Key signal: A competitor with lower visibility but stronger
citations can still become a near-term threat because trust signals are
improving faster.
## How these metrics are calculated (simple)
### Visibility %
```text theme={null}
Visibility % = (Responses where brand appears / total evaluated responses) x 100
```
### AVG position
```text theme={null}
AVG position = Sum of answer placement indexes / Number of responses where that brand appears
```
Lower value is better.
### Citations
Citations are the total source references attributed to that brand/domain in evaluated responses.
## Quick weekly checklist
1. Compare your brand with top 3 competitors.
2. Flag one competitor gaining fastest.
3. Identify one gap you can close in 1-2 sprints.
4. Assign actions to prompts and pages.
## How to use filters
* Prompt scope: isolate the commercial topic you care about.
* Platform scope: find engine-specific competitive pressure.
* Date range: validate whether movement is persistent.
## What to fix first
| Pattern in Competitors data | What it usually means | Recommended action |
| ------------------------------------ | ----------------------- | -------------------------------------------------- |
| Competitor visibility rising | Better answer relevance | Improve topical depth and prompt alignment |
| Competitor citations much stronger | Better trust footprint | Increase authority sources and proof quality |
| You lead visibility, lag on outcomes | Post-click weakness | Improve destination pages and conversion clarity |
| Losses concentrated on one platform | Platform-specific gap | Adapt content structure for that platform behavior |
## Team routine
1. Weekly: review top movers.
2. Bi-weekly: run one targeted recovery sprint.
3. Monthly: report share movement versus top competitors.
## Keep in mind
* Competitive sets evolve with prompt mix.
* Share gains without citation support are fragile.
* Short reaction cycles outperform quarterly-only reviews.
## Where to go next
* [Visibility](/data/ai-search/visibility)
* [Citations](/data/ai-search/citations)
* [Prompts](/data/ai-search/prompts)
* [Pages](/data/ai-search/pages)
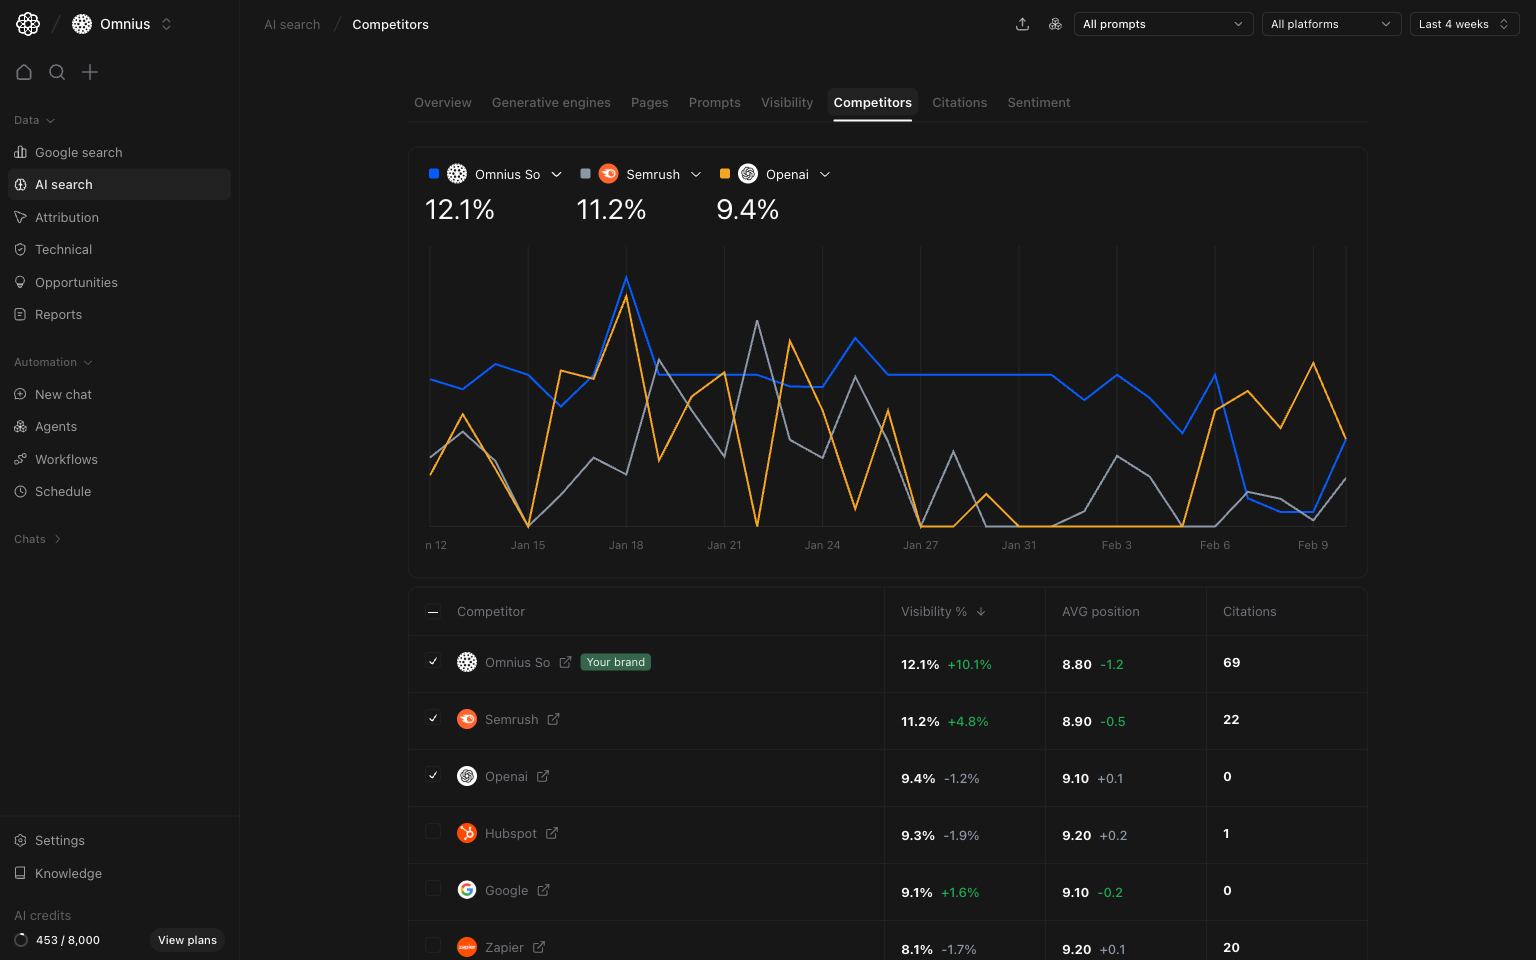 Use this page to compare your performance against direct competitors in one place.