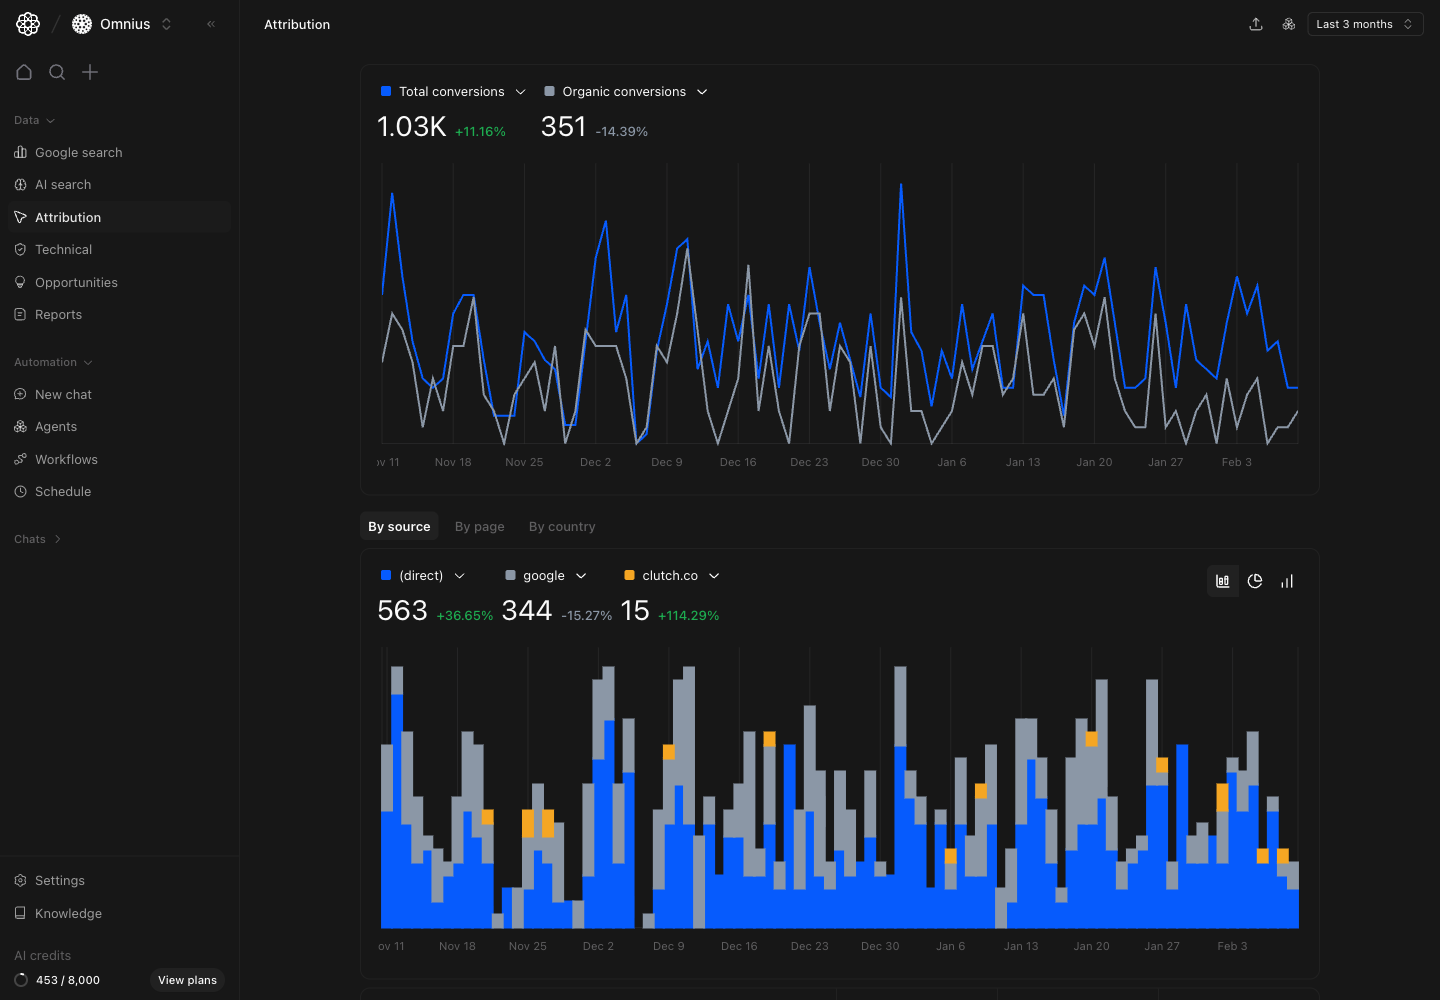
 Use this page to connect traffic activity to conversion outcomes. It helps you decide where to scale, where to fix, and where to stop spending time.
Important: Always compare sessions and conversions together. Volume without outcomes is not a growth signal.
Key signal: Sessions without conversion growth are usually a quality problem, not a scale win. Diagnose source and page fit first.
Example: A source can grow from 1,000 to 1,400 sessions while conversions stay flat. That usually means targeting or landing-page intent mismatch.
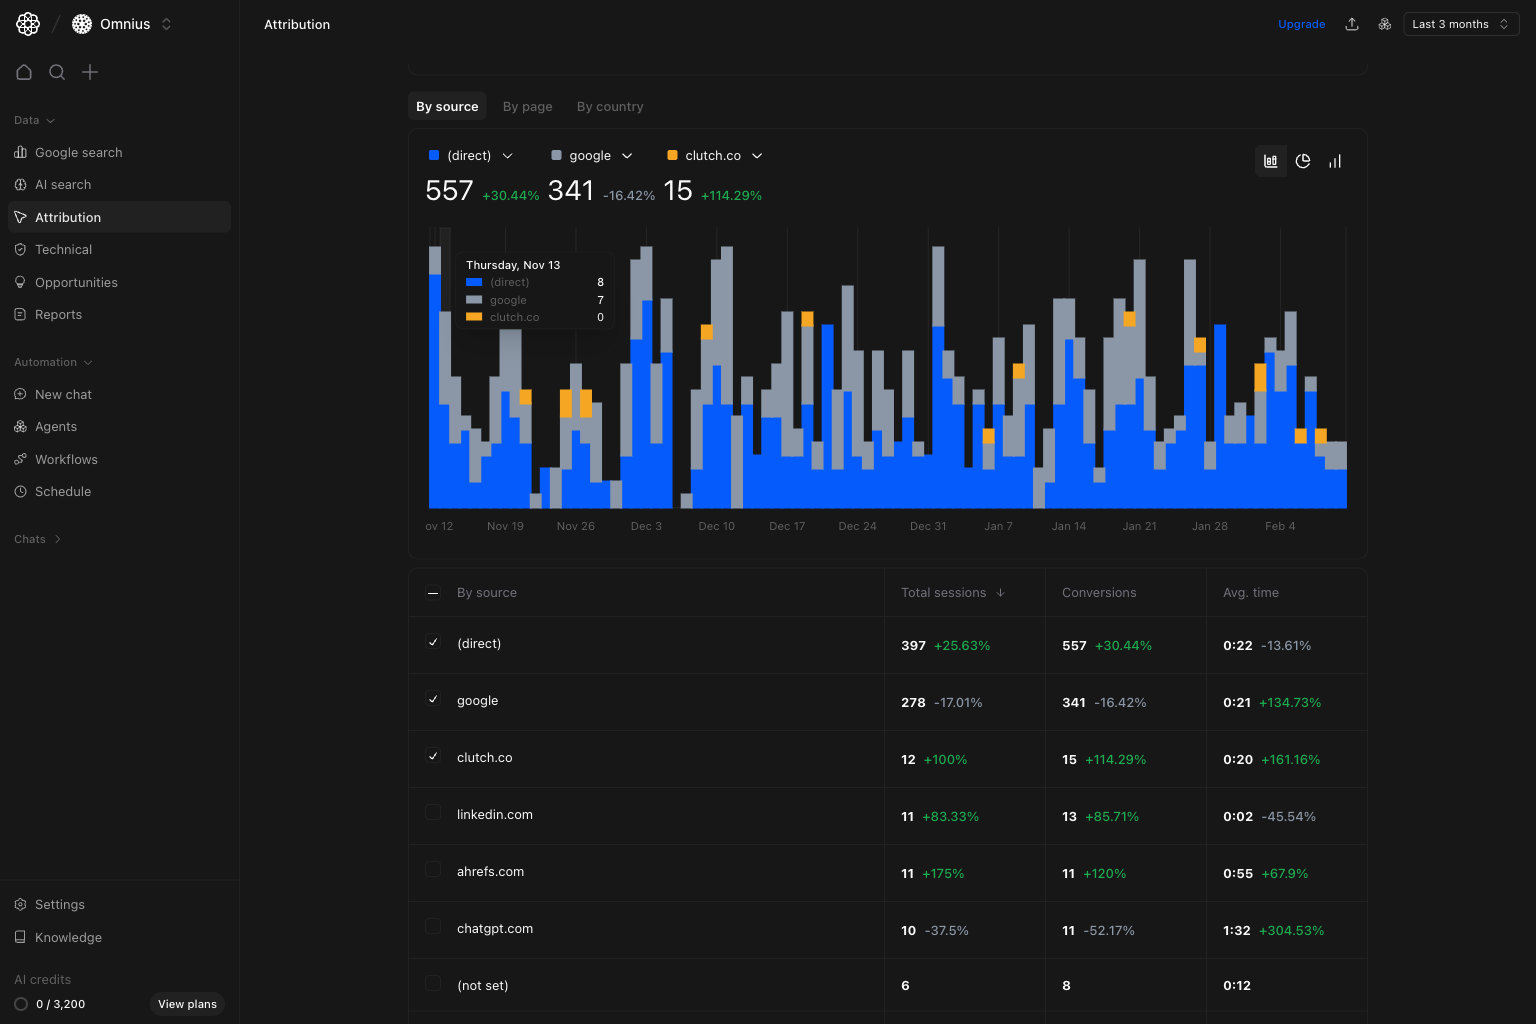 Focus on:
* `Total sessions` to see source volume.
* `Conversions` to see outcome contribution.
* `Avg. time` as a quality signal.
Take action when:
* A source has high sessions but weak conversions.
* A source has low sessions but very strong conversion rate.
* A source trend changes sharply week over week.
## By page tab
Use this tab to see which landing pages and content URLs drive conversions.
Focus on:
* `Total sessions` to see source volume.
* `Conversions` to see outcome contribution.
* `Avg. time` as a quality signal.
Take action when:
* A source has high sessions but weak conversions.
* A source has low sessions but very strong conversion rate.
* A source trend changes sharply week over week.
## By page tab
Use this tab to see which landing pages and content URLs drive conversions.
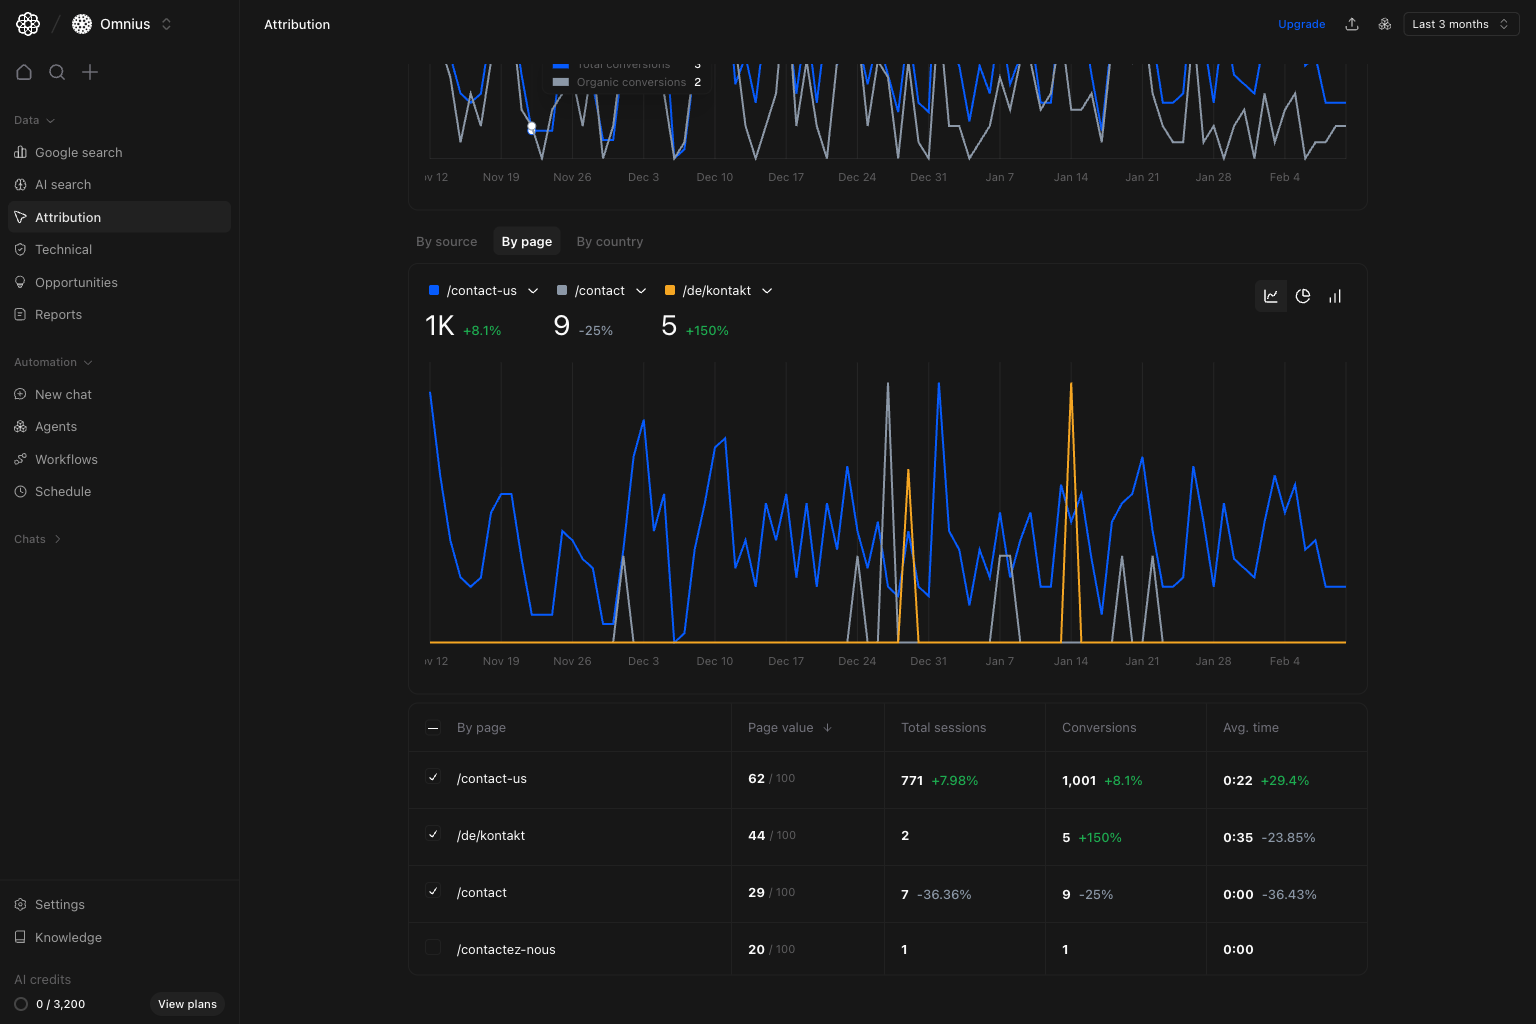 Focus on:
* `Page value` for relative page importance.
* `Total sessions` for traffic contribution.
* `Conversions` for business outcome.
Take action when:
* A high-traffic page under-converts.
* A lower-traffic page over-converts and should be scaled.
* A key commercial page shows stable traffic but conversion decline.
## By country tab
Use this tab to compare conversion performance across markets.
Focus on:
* `Page value` for relative page importance.
* `Total sessions` for traffic contribution.
* `Conversions` for business outcome.
Take action when:
* A high-traffic page under-converts.
* A lower-traffic page over-converts and should be scaled.
* A key commercial page shows stable traffic but conversion decline.
## By country tab
Use this tab to compare conversion performance across markets.
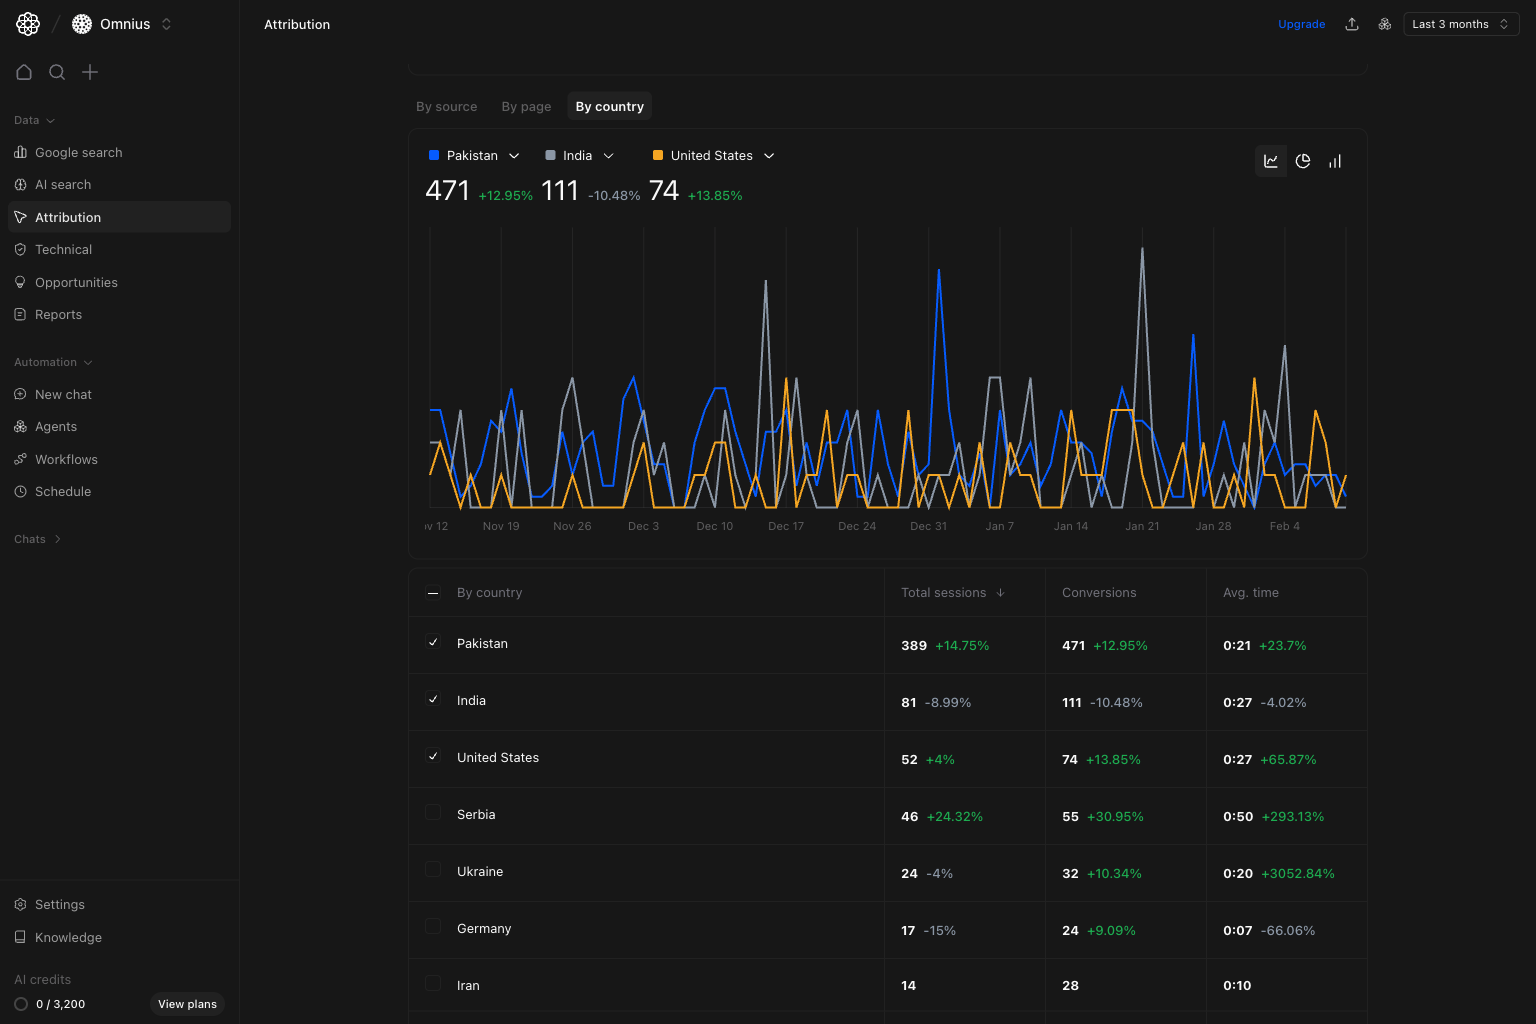 Focus on:
* Which markets produce the largest conversion volume.
* Which markets are improving or declining fastest.
* Whether average engagement differs by country.
Take action when:
* One country shows rising sessions but weak conversion growth.
* A smaller country shows strong conversion efficiency and deserves more focus.
* A priority market loses both sessions and conversions at the same time.
## Quick weekly checklist
1. Check top conversion trend direction first.
2. Review `By source` for biggest winners and losers.
3. Review `By page` for pages to scale or fix this sprint.
4. Review `By country` for market reallocation decisions.
5. Turn insights into clear actions with owner and deadline.
## What to fix first
| Pattern | What it usually means | Recommended action |
| ------------------------------------------- | ---------------------------------------- | -------------------------------------------------------- |
| High sessions, low conversions (source) | Traffic quality mismatch | Rework targeting and landing-page match |
| High page value, falling conversions (page) | Key page is losing conversion efficiency | Refresh offer clarity, CTA placement, and intent match |
| Strong conversion growth in one country | Market-message fit is strong | Replicate campaign and content investment in that market |
| Sessions and conversions both down | Demand or channel distribution issue | Validate campaign mix and content distribution quickly |
## Team routine
1. Weekly: detect source/page/country shifts and assign fixes.
2. Bi-weekly: review conversion efficiency improvements by owner.
3. Monthly: report attribution-based investment changes and outcomes.
## Keep in mind
* Attribution trends are directional, not absolute causality.
* Low-volume segments can be noisy, so validate over multiple periods.
* A conversion increase without engagement quality can be misleading.
## Where to go next
* [Google Search overview](/data/google-search/overview)
* [Google Search landing pages](/data/google-search/landing-pages)
* [AI Search overview](/data/ai-search/overview)
* [Reports](/data/reports/overview)
Focus on:
* Which markets produce the largest conversion volume.
* Which markets are improving or declining fastest.
* Whether average engagement differs by country.
Take action when:
* One country shows rising sessions but weak conversion growth.
* A smaller country shows strong conversion efficiency and deserves more focus.
* A priority market loses both sessions and conversions at the same time.
## Quick weekly checklist
1. Check top conversion trend direction first.
2. Review `By source` for biggest winners and losers.
3. Review `By page` for pages to scale or fix this sprint.
4. Review `By country` for market reallocation decisions.
5. Turn insights into clear actions with owner and deadline.
## What to fix first
| Pattern | What it usually means | Recommended action |
| ------------------------------------------- | ---------------------------------------- | -------------------------------------------------------- |
| High sessions, low conversions (source) | Traffic quality mismatch | Rework targeting and landing-page match |
| High page value, falling conversions (page) | Key page is losing conversion efficiency | Refresh offer clarity, CTA placement, and intent match |
| Strong conversion growth in one country | Market-message fit is strong | Replicate campaign and content investment in that market |
| Sessions and conversions both down | Demand or channel distribution issue | Validate campaign mix and content distribution quickly |
## Team routine
1. Weekly: detect source/page/country shifts and assign fixes.
2. Bi-weekly: review conversion efficiency improvements by owner.
3. Monthly: report attribution-based investment changes and outcomes.
## Keep in mind
* Attribution trends are directional, not absolute causality.
* Low-volume segments can be noisy, so validate over multiple periods.
* A conversion increase without engagement quality can be misleading.
## Where to go next
* [Google Search overview](/data/google-search/overview)
* [Google Search landing pages](/data/google-search/landing-pages)
* [AI Search overview](/data/ai-search/overview)
* [Reports](/data/reports/overview)