> ## Documentation Index
> Fetch the complete documentation index at: https://docs.atomicagi.com/llms.txt
> Use this file to discover all available pages before exploring further.
# Referrals
> Understand referral patterns tied to organic discovery
 Use this page to see which external sites are sending traffic to your content. It helps you answer three practical questions:
1. Which referral domains are growing and sending useful traffic?
2. Which sources are declining and need replacement or recovery?
3. How should SEO, PR, and distribution priorities change based on source movement?
## Before you analyze
* Use a stable comparison window so short-term spikes do not mislead you.
* Start with top sources, then scan mid-tier sources for emerging channels.
* Review both session volume and percentage change before setting priorities.
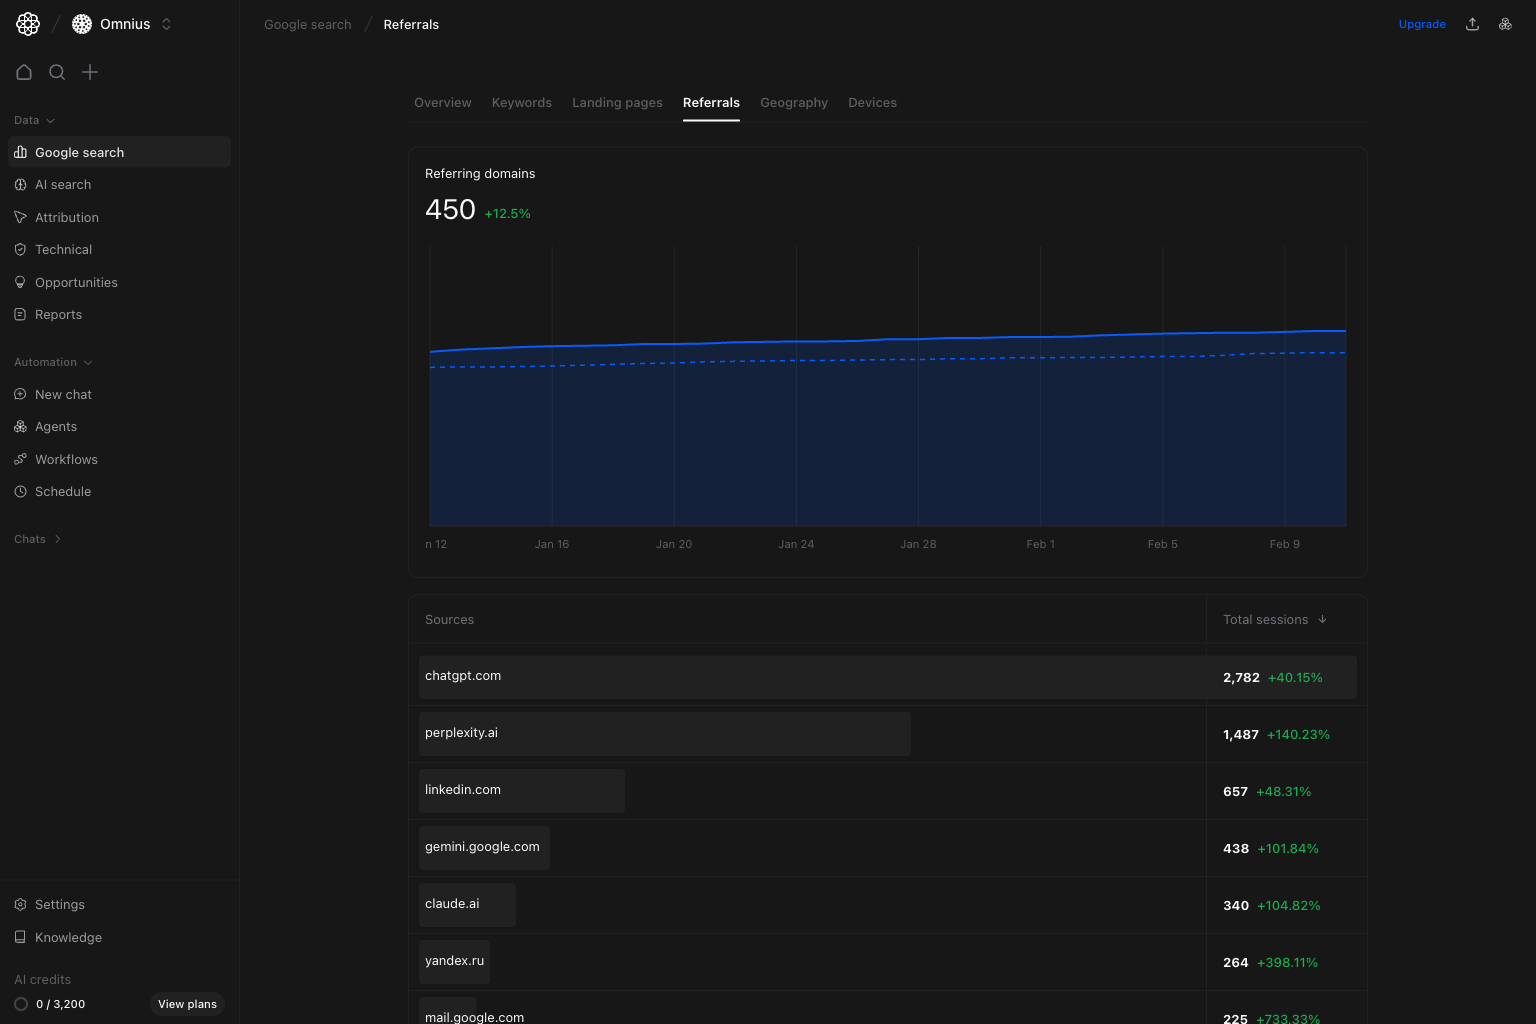
## What this page gives you
The Referrals page combines:
* A `Referring domains` trend card to show how your source mix changes over time.
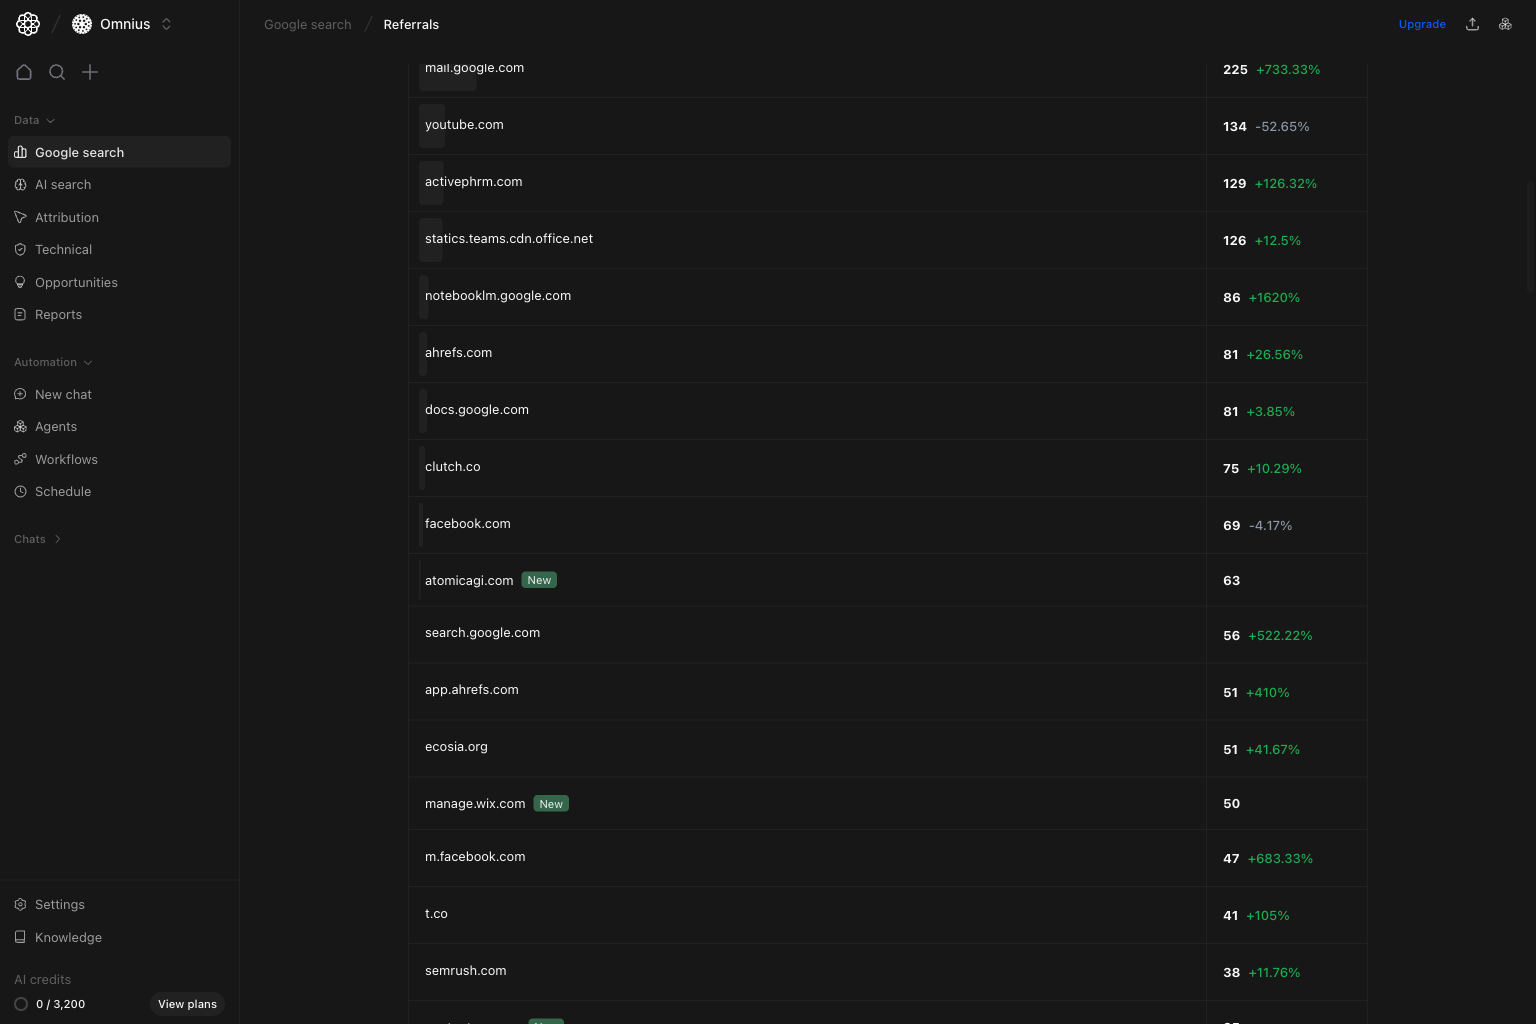
* A sources table with `Total sessions` and directional deltas.
* Source labels in rows (`new`, `lost`) so you can track churn.
## How to read this page correctly
* `Referring domains` up with flat sessions can mean broader but shallower discovery.
* Sessions up from a small set of domains can signal concentration risk.
* High growth percentages on tiny baselines should not outweigh high-volume stable sources.
## Quick weekly checklist
1. Start with domain trend.
Confirm whether source footprint is expanding or shrinking.
2. Review top-volume sources.
Validate if core referrers are stable enough to rely on.
3. Scan fast movers.
Separate meaningful emerging channels from one-off spikes.
4. Inspect `new` and `lost` labels.
Catch partner drop-offs, platform shifts, or campaign changes.
5. Turn findings into an action list.
Assign source-level actions to SEO, content distribution, and partnerships.
Use this middle table zone for weekly source prioritization.
Use this page to see which external sites are sending traffic to your content. It helps you answer three practical questions:
1. Which referral domains are growing and sending useful traffic?
2. Which sources are declining and need replacement or recovery?
3. How should SEO, PR, and distribution priorities change based on source movement?
## Before you analyze
* Use a stable comparison window so short-term spikes do not mislead you.
* Start with top sources, then scan mid-tier sources for emerging channels.
* Review both session volume and percentage change before setting priorities.
## What this page gives you
The Referrals page combines:
* A `Referring domains` trend card to show how your source mix changes over time.
* A sources table with `Total sessions` and directional deltas.
* Source labels in rows (`new`, `lost`) so you can track churn.
## How to read this page correctly
* `Referring domains` up with flat sessions can mean broader but shallower discovery.
* Sessions up from a small set of domains can signal concentration risk.
* High growth percentages on tiny baselines should not outweigh high-volume stable sources.
## Quick weekly checklist
1. Start with domain trend.
Confirm whether source footprint is expanding or shrinking.
2. Review top-volume sources.
Validate if core referrers are stable enough to rely on.
3. Scan fast movers.
Separate meaningful emerging channels from one-off spikes.
4. Inspect `new` and `lost` labels.
Catch partner drop-offs, platform shifts, or campaign changes.
5. Turn findings into an action list.
Assign source-level actions to SEO, content distribution, and partnerships.
Use this middle table zone for weekly source prioritization.
 ## What to fix first
| Pattern in source table | What it usually means | Recommended action |
| -------------------------------------------- | ----------------------------------- | ------------------------------------------------------ |
| High sessions, positive growth | Reliable source channel | Protect and scale with repeat placements |
| High sessions, negative growth | Channel fatigue or lower visibility | Refresh distribution hooks and update linking assets |
| Low sessions, very high growth | Early source opportunity | Run small tests before scaling effort |
| `new` sources with repeat sessions | New channels are starting to work | Build repeatable collaboration or syndication workflow |
| `lost` sources with prior meaningful traffic | Broken loop or campaign drop-off | Investigate and create a recovery or replacement plan |
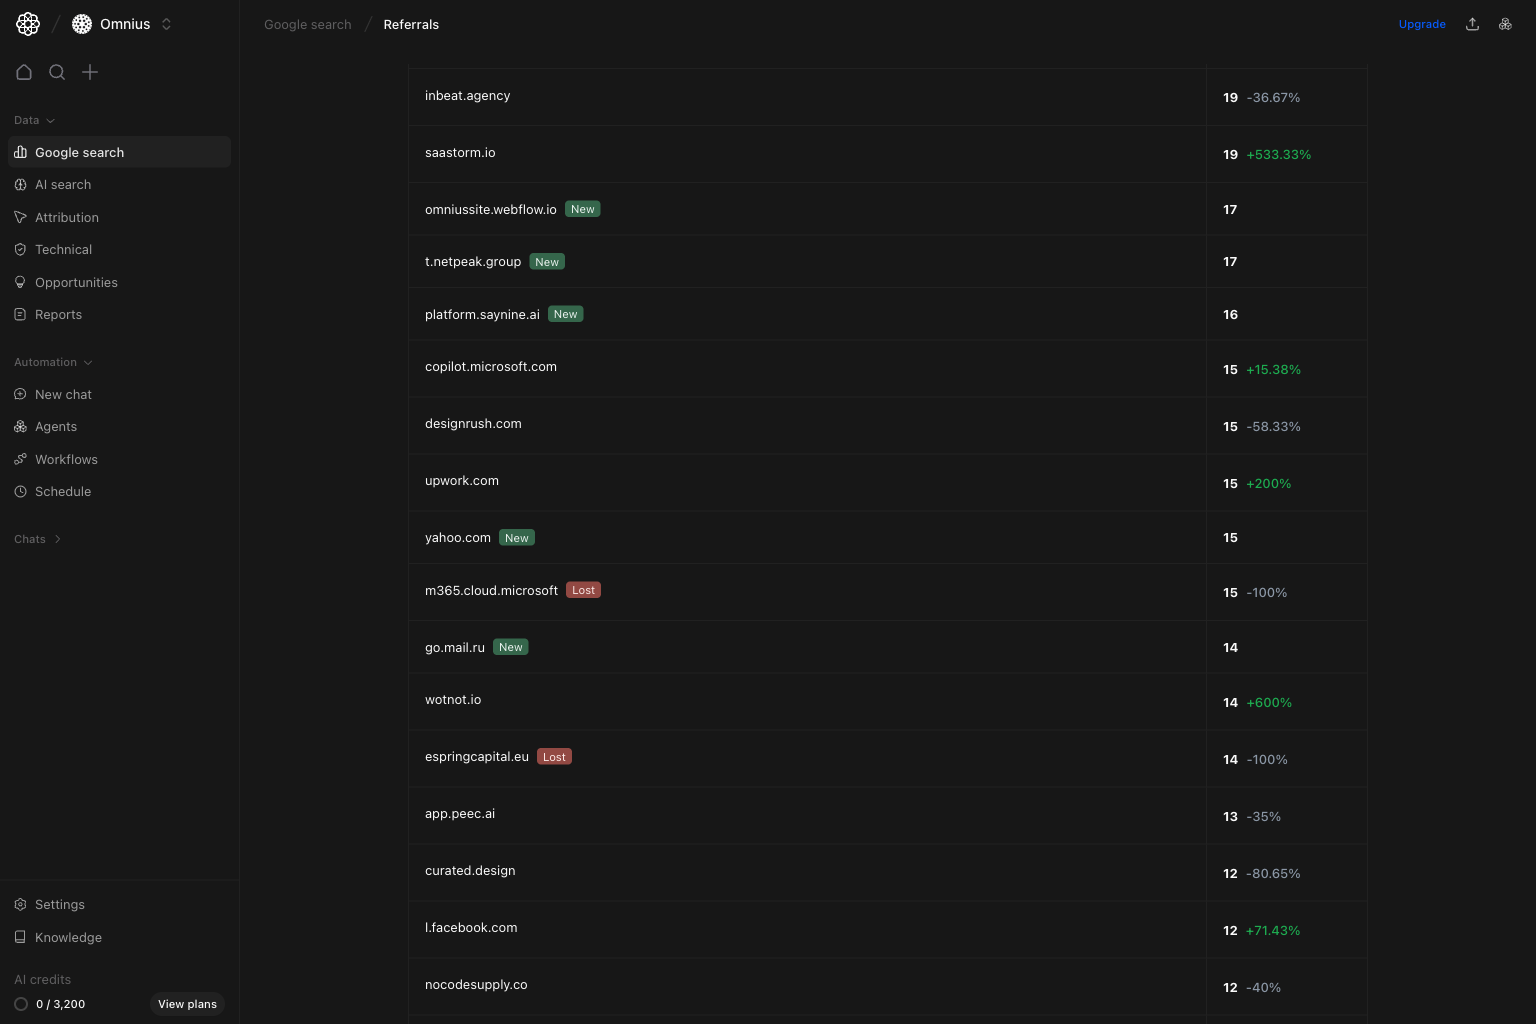
## Track new and lost sources
This deeper table view helps you spot source churn that top-level numbers can hide.
## What to fix first
| Pattern in source table | What it usually means | Recommended action |
| -------------------------------------------- | ----------------------------------- | ------------------------------------------------------ |
| High sessions, positive growth | Reliable source channel | Protect and scale with repeat placements |
| High sessions, negative growth | Channel fatigue or lower visibility | Refresh distribution hooks and update linking assets |
| Low sessions, very high growth | Early source opportunity | Run small tests before scaling effort |
| `new` sources with repeat sessions | New channels are starting to work | Build repeatable collaboration or syndication workflow |
| `lost` sources with prior meaningful traffic | Broken loop or campaign drop-off | Investigate and create a recovery or replacement plan |
## Track new and lost sources
This deeper table view helps you spot source churn that top-level numbers can hide.
 * Rising `new` sources with low volume: validate quality before scaling.
* Repeated `lost` labels on formerly strong domains: trigger recovery workflow.
* Mixed trend (many new + many lost): treat as channel instability, not pure growth.
## Team routine
1. Weekly: identify top 5 gaining and top 5 declining sources.
2. Bi-weekly: map source changes to recent content or campaign launches.
3. Monthly: report referral mix, dependency risk, and next channel experiments.
4. Quarterly: rebalance channel strategy based on sustained referral contribution.
## Keep in mind
* Referral traffic can spike from short-lived mentions; confirm it lasts.
* Percentage growth without baseline context can mislead prioritization.
* Not every referral source matches your target intent; align quality with conversions.
## Where to go next
* [Google Search overview](/data/google-search/overview): top-level organic movement context
* [Landing pages](/data/google-search/landing-pages): which URLs are benefiting from referral traffic
* [Keywords](/data/google-search/keywords): queries behind the pages that sources amplify
* [Geography](/data/google-search/geography): market-level differences in referral impact
* Rising `new` sources with low volume: validate quality before scaling.
* Repeated `lost` labels on formerly strong domains: trigger recovery workflow.
* Mixed trend (many new + many lost): treat as channel instability, not pure growth.
## Team routine
1. Weekly: identify top 5 gaining and top 5 declining sources.
2. Bi-weekly: map source changes to recent content or campaign launches.
3. Monthly: report referral mix, dependency risk, and next channel experiments.
4. Quarterly: rebalance channel strategy based on sustained referral contribution.
## Keep in mind
* Referral traffic can spike from short-lived mentions; confirm it lasts.
* Percentage growth without baseline context can mislead prioritization.
* Not every referral source matches your target intent; align quality with conversions.
## Where to go next
* [Google Search overview](/data/google-search/overview): top-level organic movement context
* [Landing pages](/data/google-search/landing-pages): which URLs are benefiting from referral traffic
* [Keywords](/data/google-search/keywords): queries behind the pages that sources amplify
* [Geography](/data/google-search/geography): market-level differences in referral impact