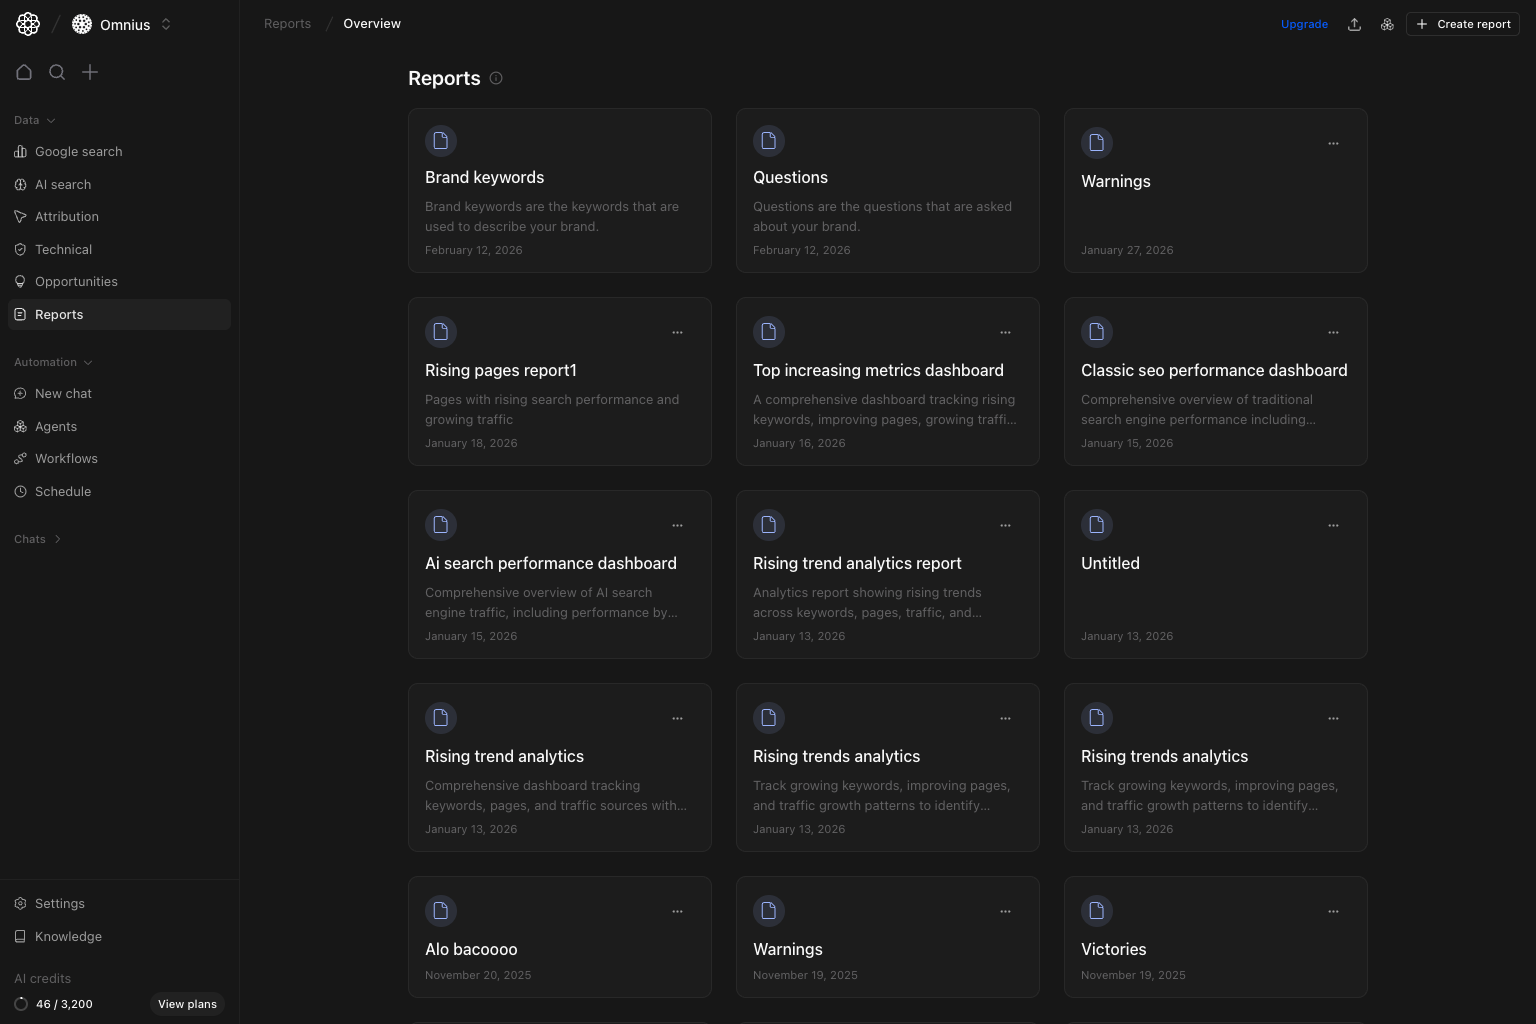
 Use this page to create, organize, and deliver reporting views for clients and internal teams.
Important: Treat reports as a reusable system. Keep structure stable, update data and commentary each cycle.
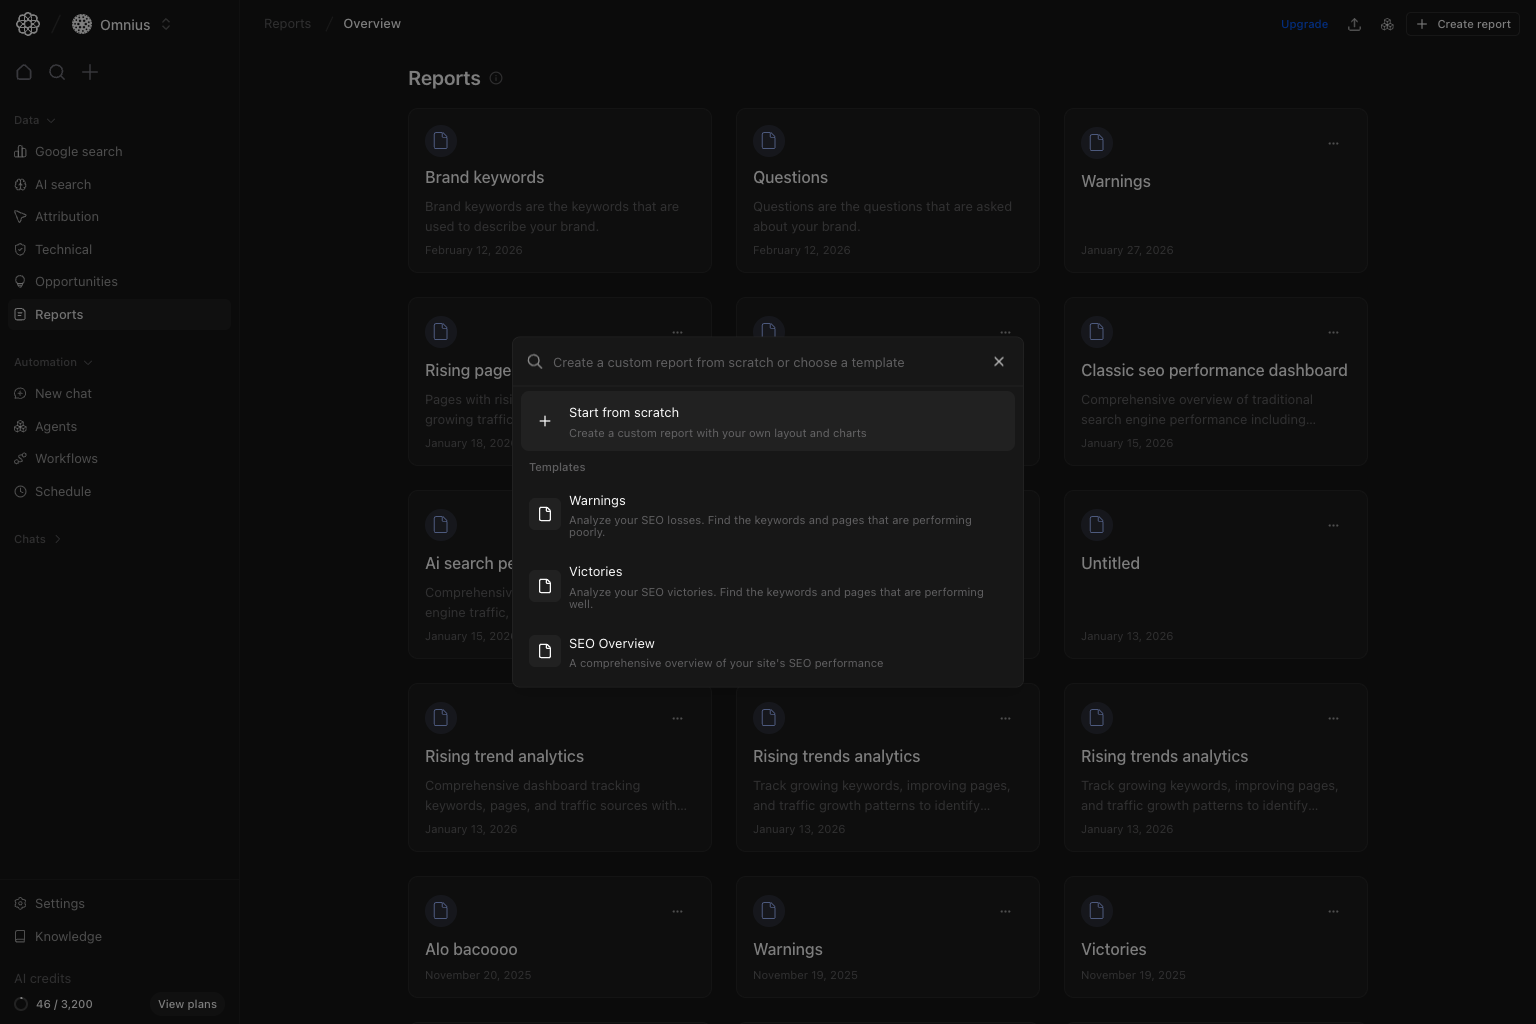 When you click `Create report`, you can:
* `Start from scratch`: empty layout, add blocks manually.
* Choose a template: starts with predefined layout blocks.
**Your task:** Start with a template unless you have a clear custom layout requirement.
Current templates include patterns like `Warnings`, `Victories`, `SEO Overview`, `Conversion tracking`, `Page performance`, and `Geographic analysis`.
## Open and read a report
When you click `Create report`, you can:
* `Start from scratch`: empty layout, add blocks manually.
* Choose a template: starts with predefined layout blocks.
**Your task:** Start with a template unless you have a clear custom layout requirement.
Current templates include patterns like `Warnings`, `Victories`, `SEO Overview`, `Conversion tracking`, `Page performance`, and `Geographic analysis`.
## Open and read a report
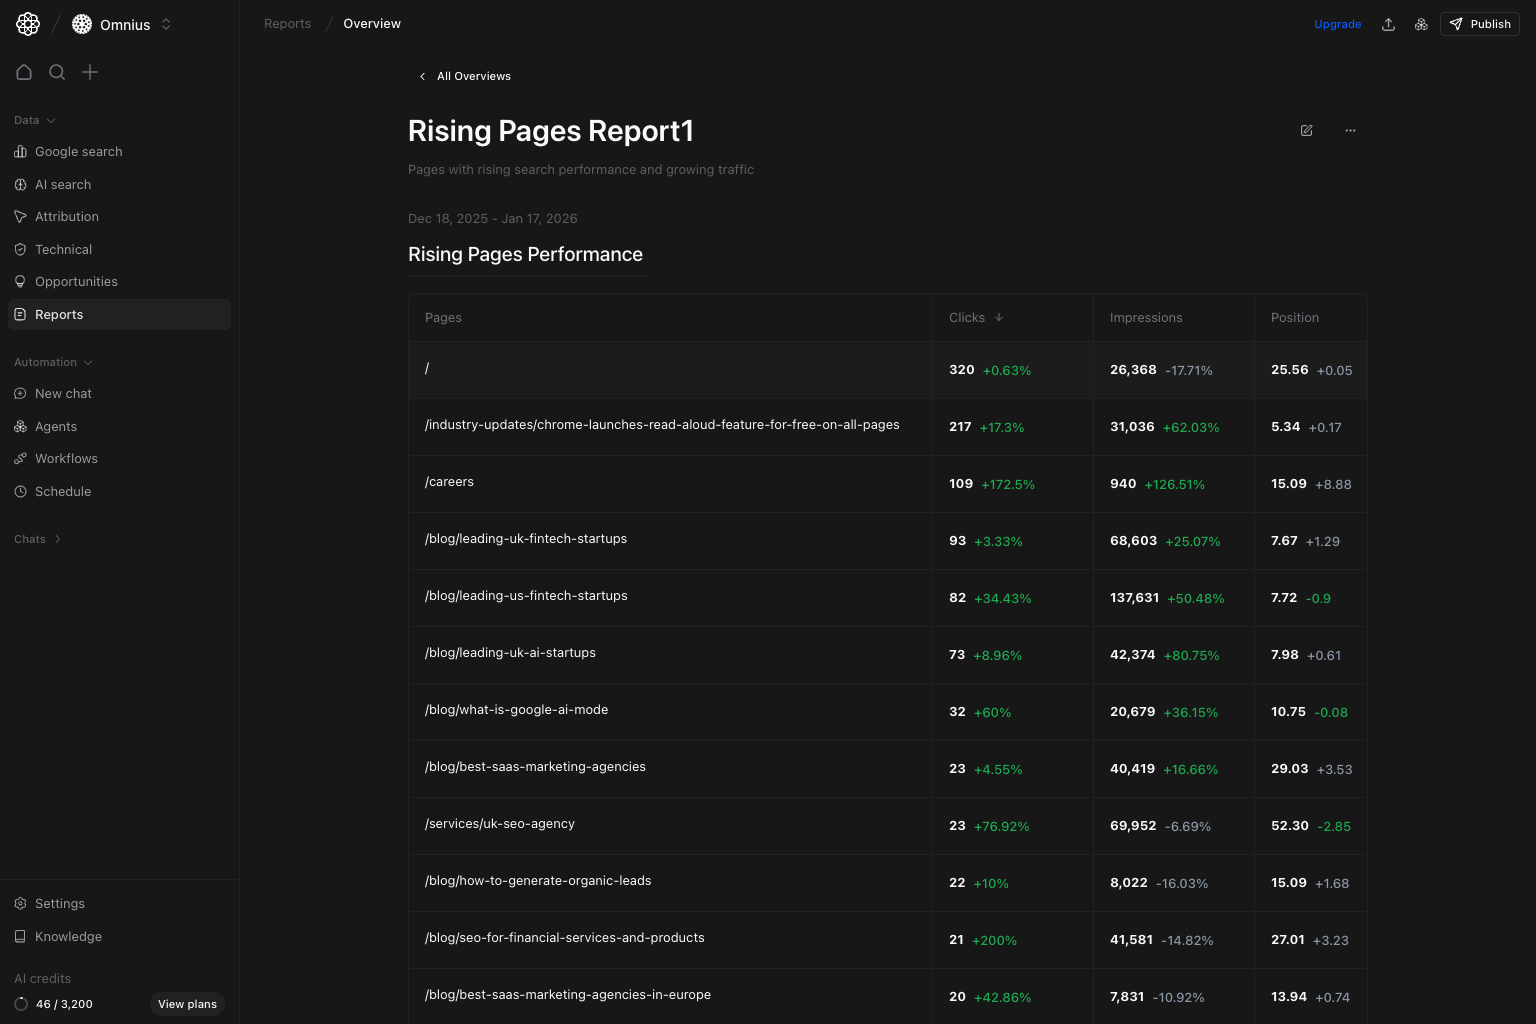 In report view you can:
* Read report blocks that render live analytics components.
* Use top actions to edit, duplicate, delete, or publish (if you have write access).
* Keep report structure stable while data refreshes from connected sources.
## Edit mode workflow
In report view you can:
* Read report blocks that render live analytics components.
* Use top actions to edit, duplicate, delete, or publish (if you have write access).
* Keep report structure stable while data refreshes from connected sources.
## Edit mode workflow
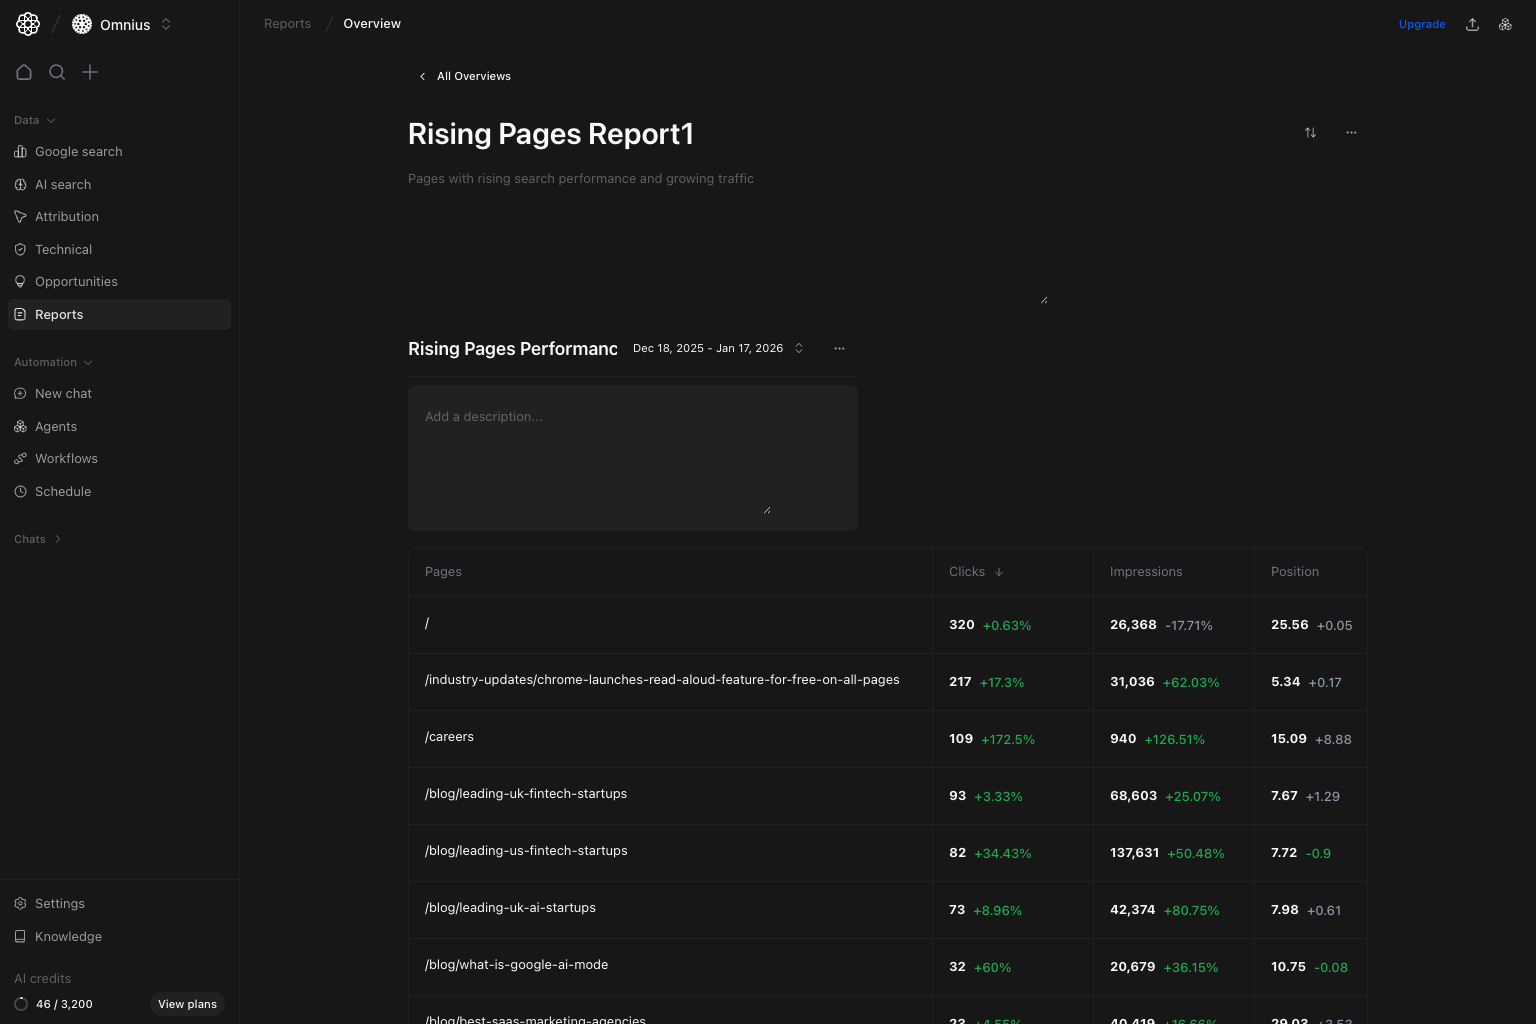 In report edit mode, you can:
* Rename report title and description.
* Toggle block reorder mode.
* Add layout blocks by selecting:
data source -> section -> view type -> filters -> date range.
* Remove or reorder blocks.
Changes persist to the report configuration so the same layout can be reused in future periods.
## Publish and share
`Publish` exposes a shareable public URL for the report.
**Your task:** Publish only after final QA of filters, date range, and block titles.
Recommended workflow:
1. Finalize report title, description, and blocks.
2. Click `Publish`.
3. Copy the generated public URL.
4. Share with stakeholders.
## Quick weekly checklist
1. Remove stale drafts and duplicate cards.
2. Reuse templates for recurring reporting cycles.
3. Verify critical blocks still load expected data.
4. Re-publish after major report structure changes.
## Keep in mind
* Report quality depends on upstream data-source health.
* Predefined reports are fast shortcuts; custom reports give full layout control.
* Publish links are easiest to consume for non-product viewers.
## Where to go next
* [Google Search Overview](/data/google-search/overview)
* [AI Search Overview](/data/ai-search/overview)
* [Attribution](/data/attribution/overview)
In report edit mode, you can:
* Rename report title and description.
* Toggle block reorder mode.
* Add layout blocks by selecting:
data source -> section -> view type -> filters -> date range.
* Remove or reorder blocks.
Changes persist to the report configuration so the same layout can be reused in future periods.
## Publish and share
`Publish` exposes a shareable public URL for the report.
**Your task:** Publish only after final QA of filters, date range, and block titles.
Recommended workflow:
1. Finalize report title, description, and blocks.
2. Click `Publish`.
3. Copy the generated public URL.
4. Share with stakeholders.
## Quick weekly checklist
1. Remove stale drafts and duplicate cards.
2. Reuse templates for recurring reporting cycles.
3. Verify critical blocks still load expected data.
4. Re-publish after major report structure changes.
## Keep in mind
* Report quality depends on upstream data-source health.
* Predefined reports are fast shortcuts; custom reports give full layout control.
* Publish links are easiest to consume for non-product viewers.
## Where to go next
* [Google Search Overview](/data/google-search/overview)
* [AI Search Overview](/data/ai-search/overview)
* [Attribution](/data/attribution/overview)