
Connect the website
If the page saysConnect your website to see crawler logs, use Connect website and follow the connection panel. You need permission to change project data sources. If you can only read the page, ask a project administrator to complete setup. Choose the matching installation route: Cloudflare, Vercel, or WordPress. Follow its displayed instructions, then use the connection check. A created key alone is not proof that logs are arriving. Allow new requests to arrive before interpreting an empty period.
Overview tab
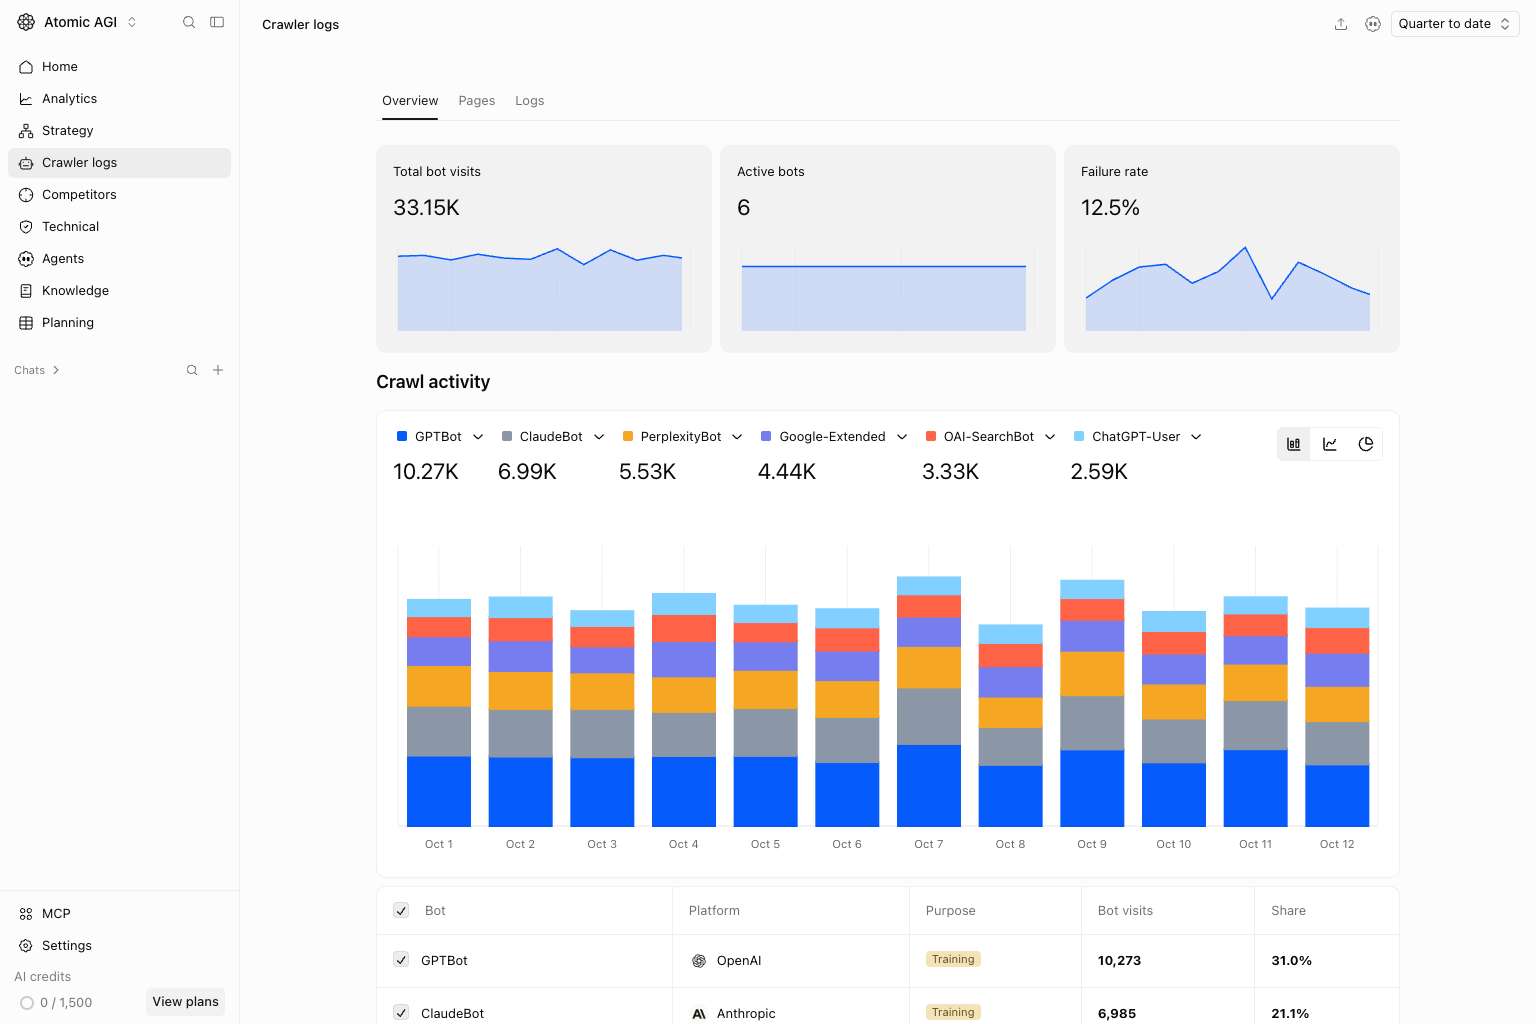
Use the summary and crawl activity chart to identify changes in visits. Compare the platform, bot, folder, URL, and HTTP status breakdowns. Switch between Stacked bars, Line chart, and Pie chart to compare timing or share. Rising activity accompanied by 4xx or 5xx responses needs investigation before you assume improved discoverability.Stacked bars
Compare daily request volume by bot. A spike from one crawler should lead to a review of its URLs and response statuses.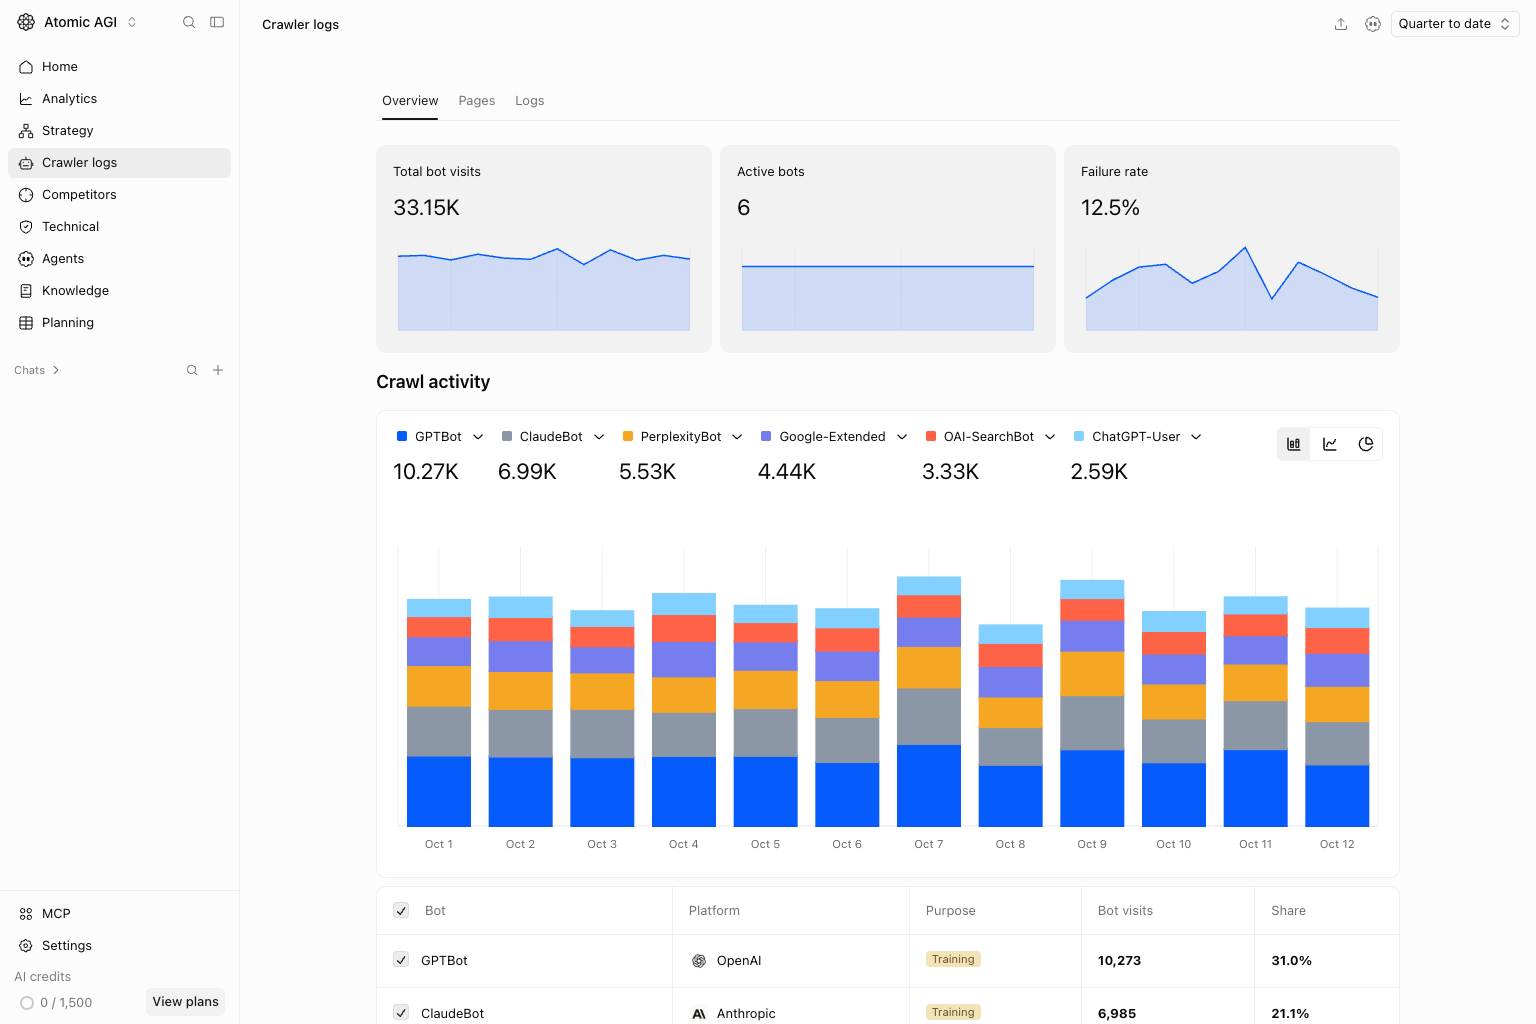
Line chart
Follow changes over time for the selected bots. Check the underlying counts before treating a short spike as a sustained trend.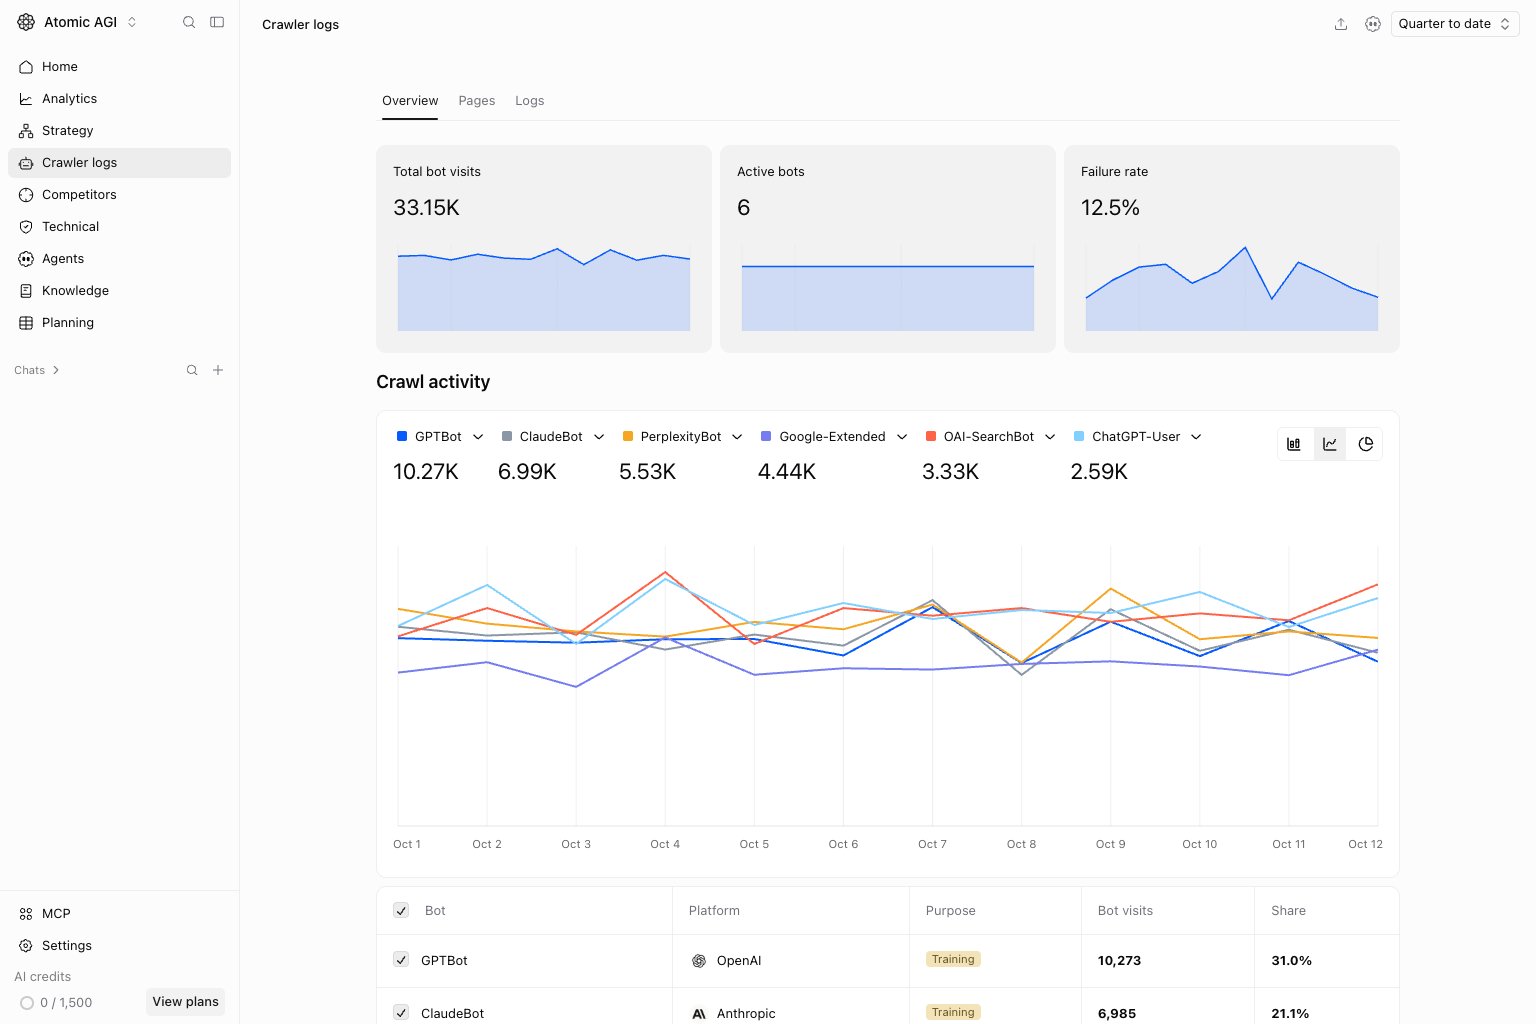
Pie chart
Compare each selected bot’s share of observed requests across the period. A large share measures crawling activity, not answer visibility.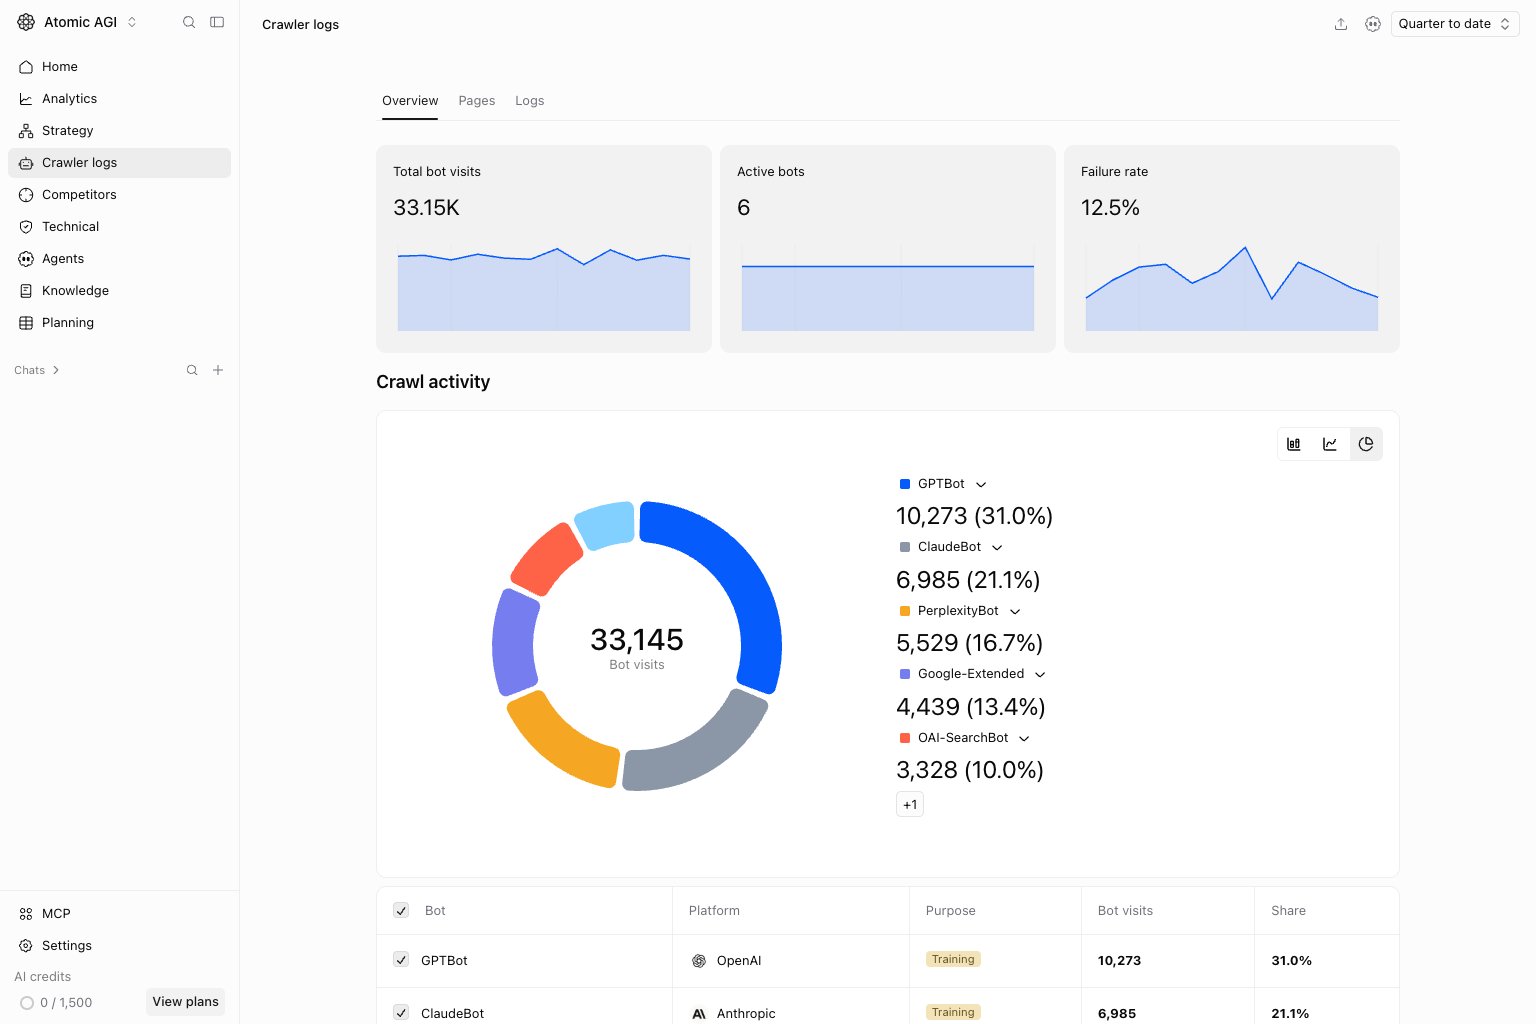
Pages tab
Open Pages to compare visited URLs, platforms, and response statuses. Filter to important pages or a folder to see whether crawlers reach the content you want discovered. A page absent from these logs has no observed visits in the selected scope; this does not prove that every AI provider is unable to access it.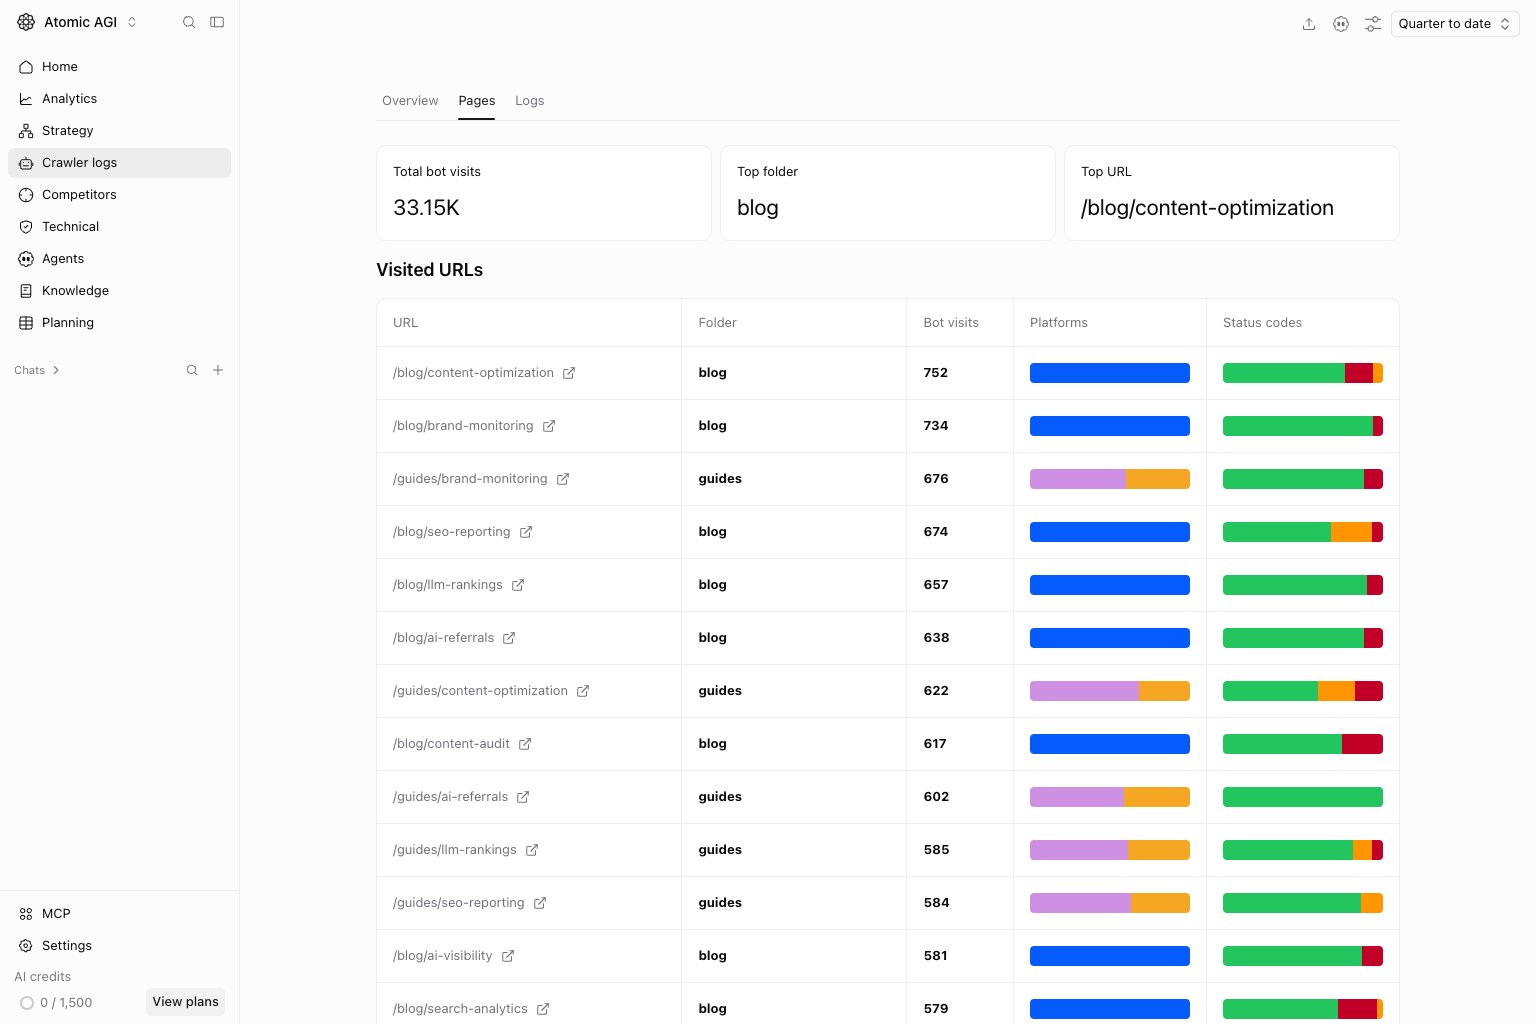
Logs tab
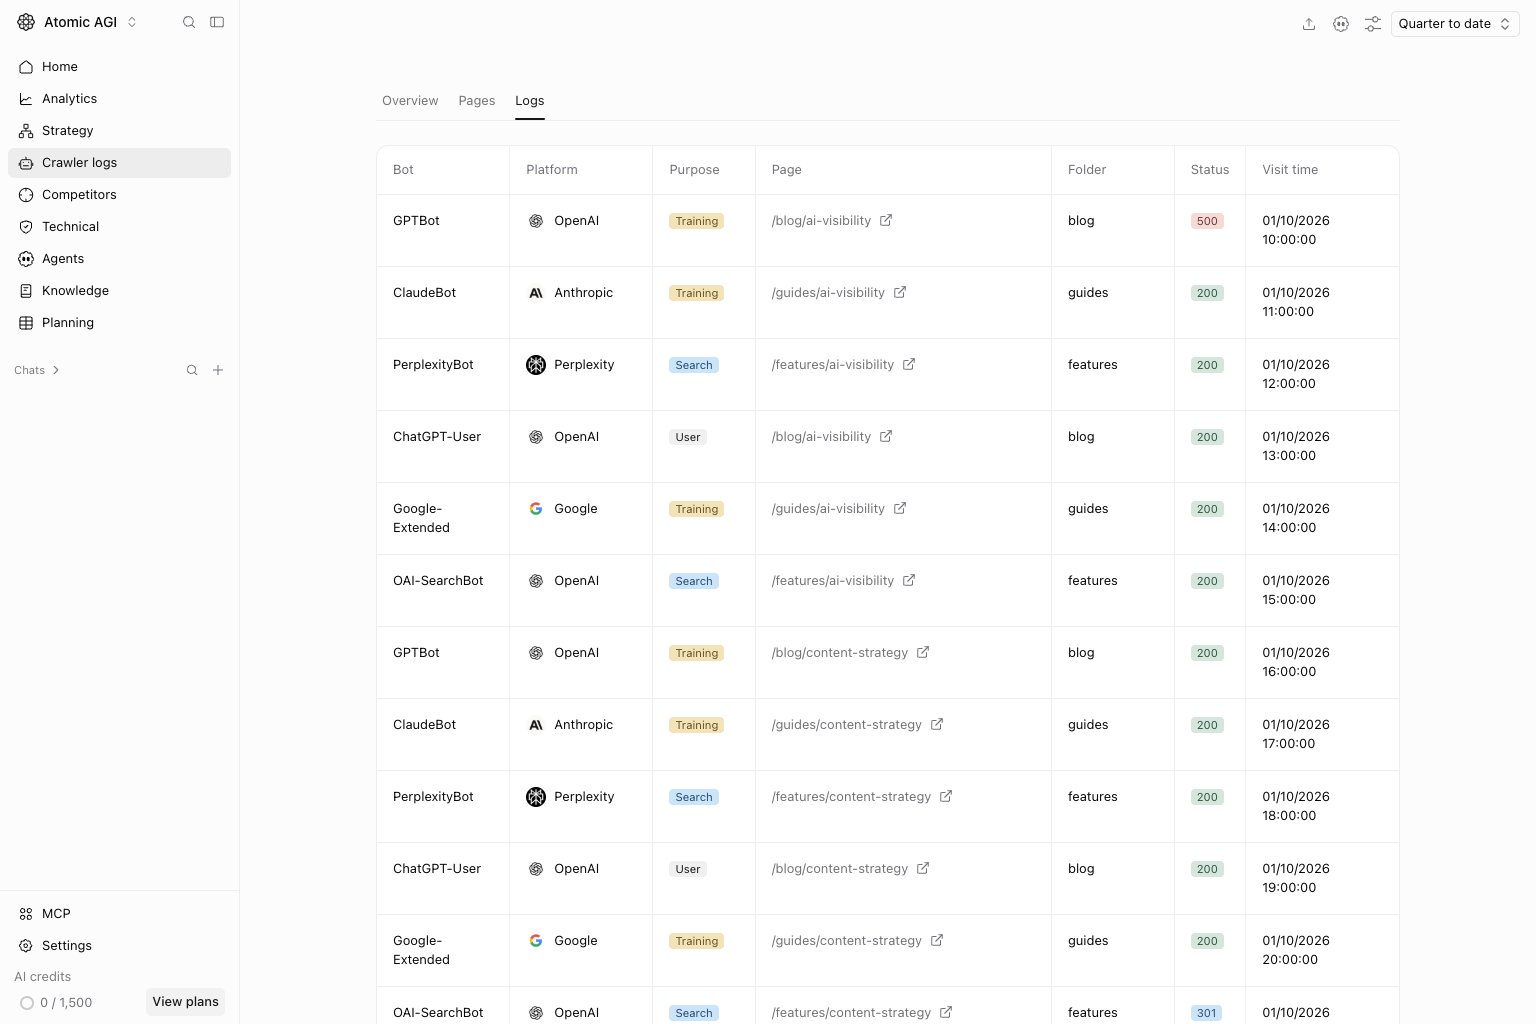
Use Logs to inspect individual requests and their times, bot/platform, URL, and response. Narrow the date range and filters before paging through events. Correlate failed responses with website changes or access rules; a successful response does not guarantee inclusion in an AI answer.