

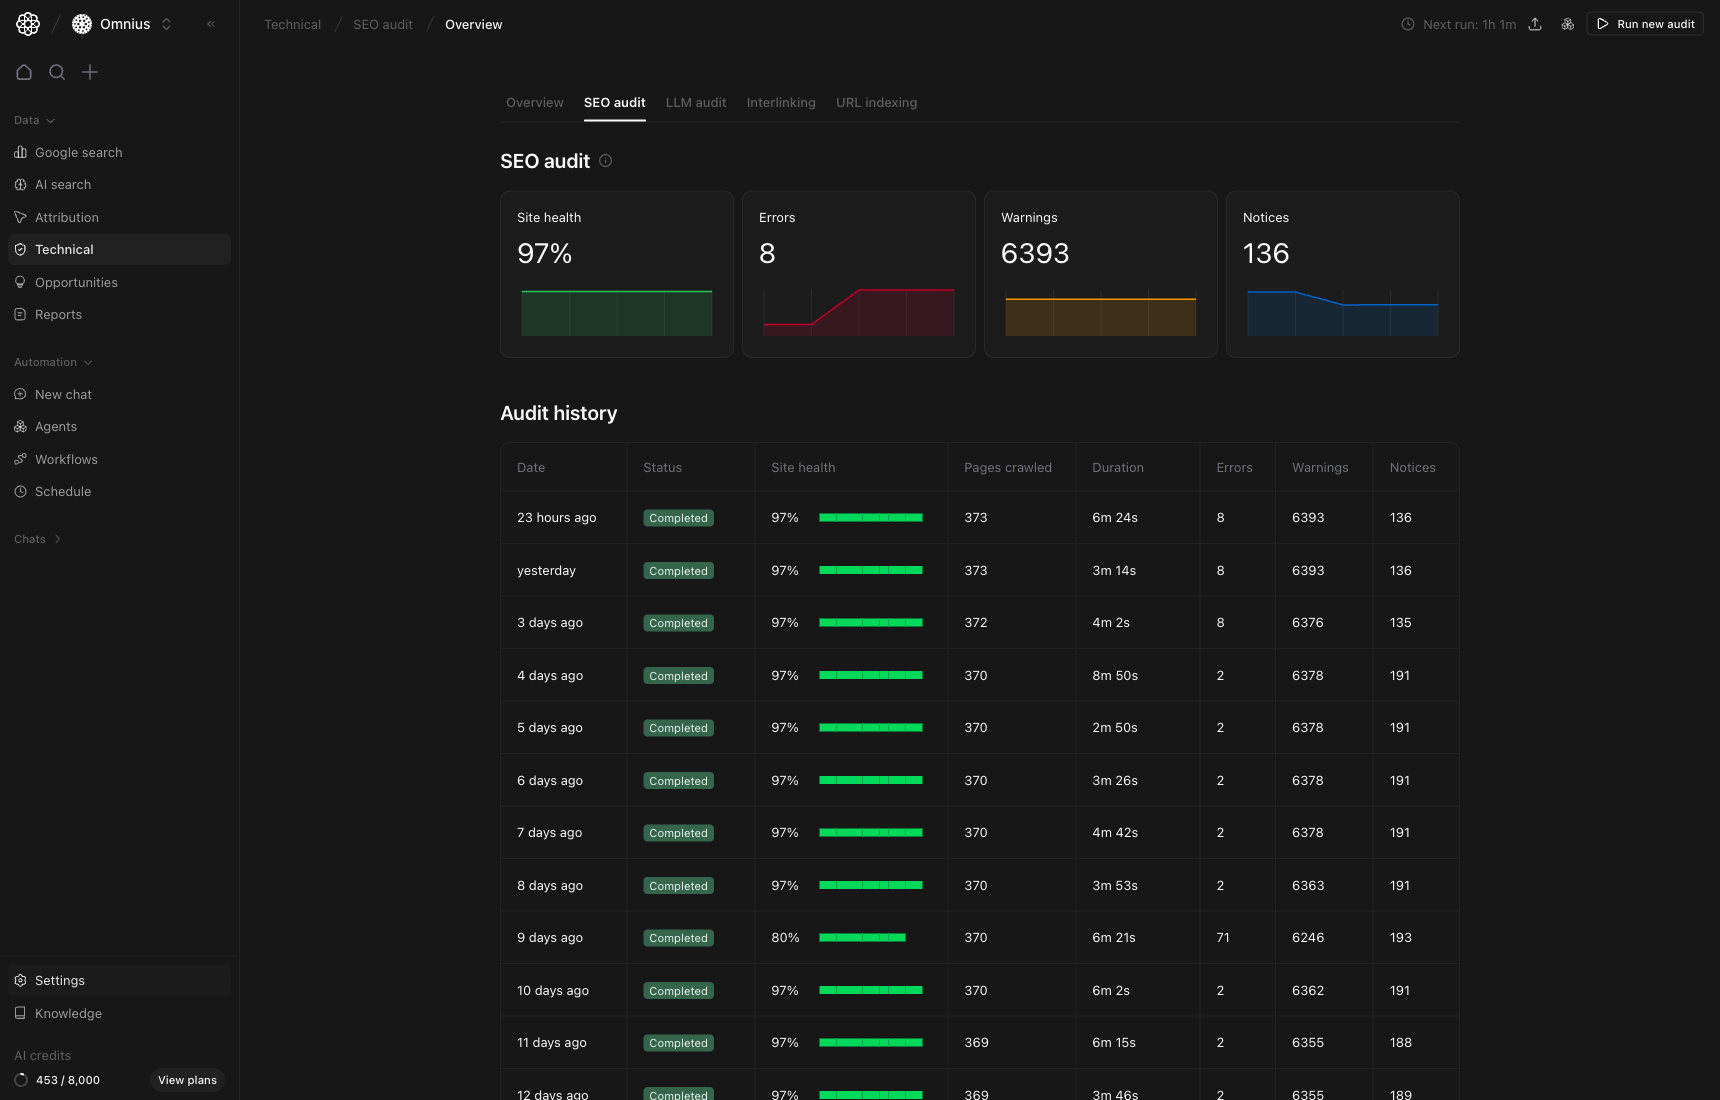
Important: Fix highest-severity template-level issues first. They usually unlock the fastest site-wide improvement.
Questions this page should answer
- Is technical health improving from audit to audit?
- Which issue groups are causing the biggest risk right now?
- Which exact URLs should be fixed first this sprint?
Before you analyze
- Keep the same date range used in your weekly reporting cadence.
- Start with the summary cards, then open the newest completed run.
- Compare at least two runs before assigning root cause.
What this page gives you
- Top-level technical health snapshot (
Site health,Errors,Warnings,Notices). - Run-level diagnosis with issue grouping and crawl behavior.
- URL-level issue detail to create precise execution tasks.
- A complete triage path in one document.
How to read the top cards
Site health: overall technical quality score for the crawl.Errors: highest-priority issues that can block crawling/indexing quality.Warnings: medium-priority issues that can create risk if ignored.Notices: lower-priority issues to batch and resolve over time.
- Rising
Errorsmeans immediate action. - Flat but high
Warningsmeans hidden debt that can become future blockers. - Stable
Site healthwith concentrated issues still requires focused fixes.
Key signal: If errors rise and pages crawled stay stable, the issue is usually real quality degradation, not sampling noise.
How these metrics are calculated (simple)
Site health
Errors / Warnings / Notices
Severity counts are direct totals of findings grouped by severity (Error, Warning, Notice).
How to use audit history
UseAudit history to choose the run to investigate first:
- Open the newest completed run first.
- Compare with the previous run for issue-trend confirmation.
- Watch
Pages crawledandDurationto detect crawl volatility.
Run detail: All issues view
This is where you prioritize issue categories by impact before touching individual URLs.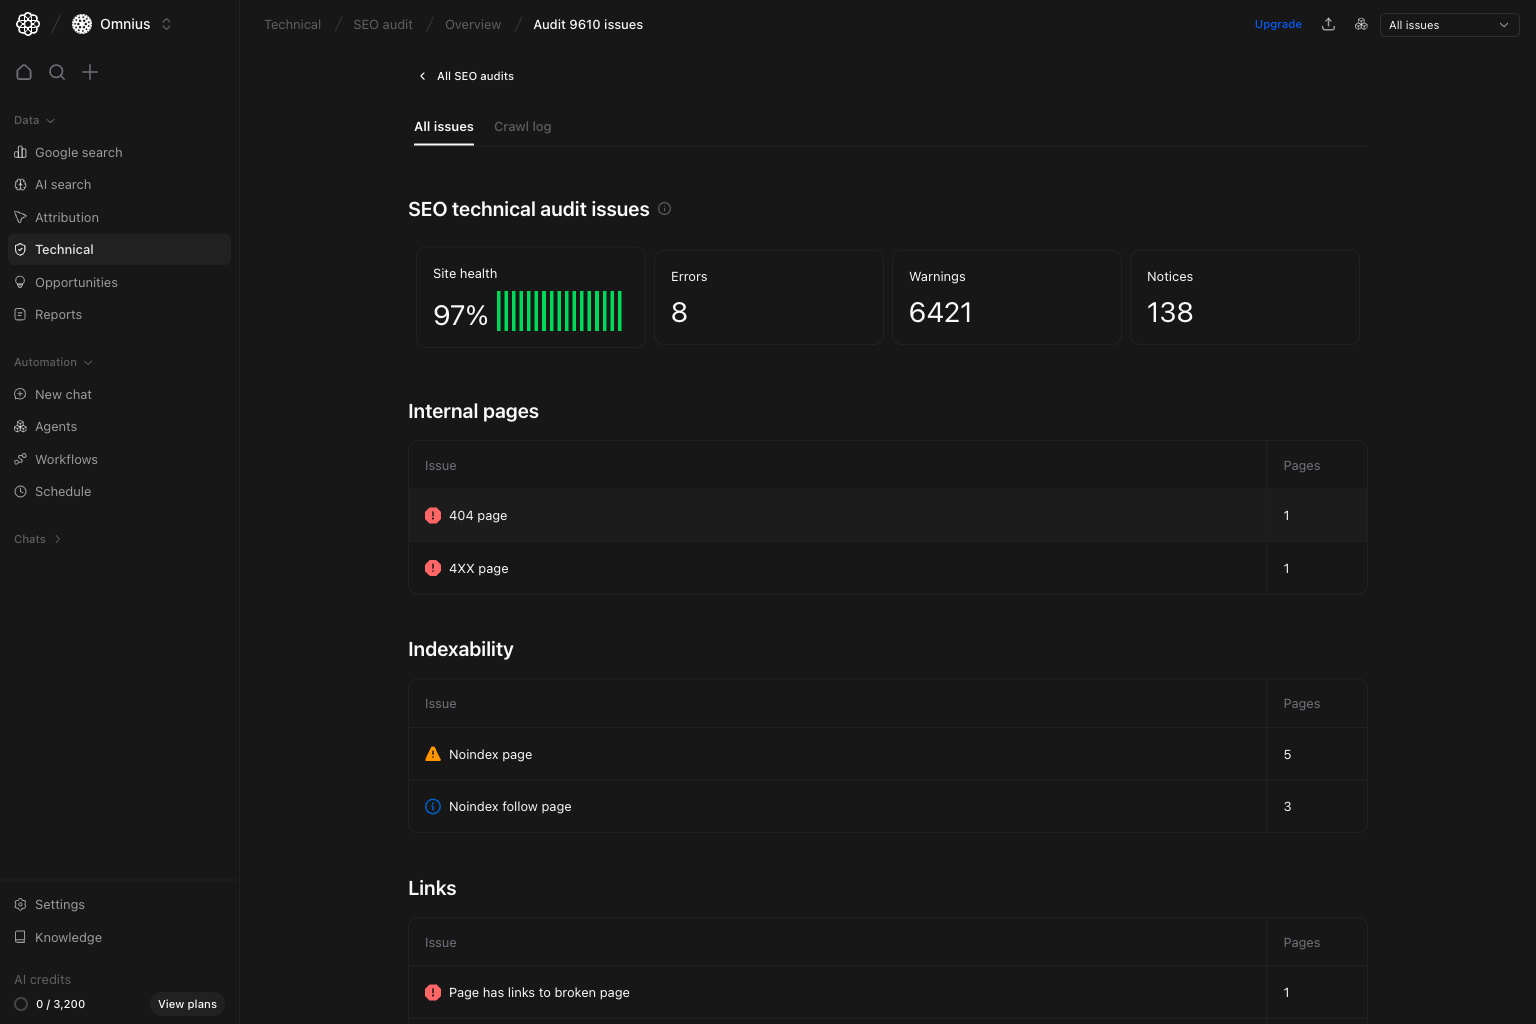
- Identify issue groups affecting the most pages.
- Prioritize error classes on key templates first.
- Choose one high-impact issue class and close it end-to-end.
- Whether risk is concentrated in one technical area.
- Whether the issue is likely template-wide or page-specific.
Run detail: Crawl log view
Use crawl log when you need evidence about how URLs were crawled and where failures happened.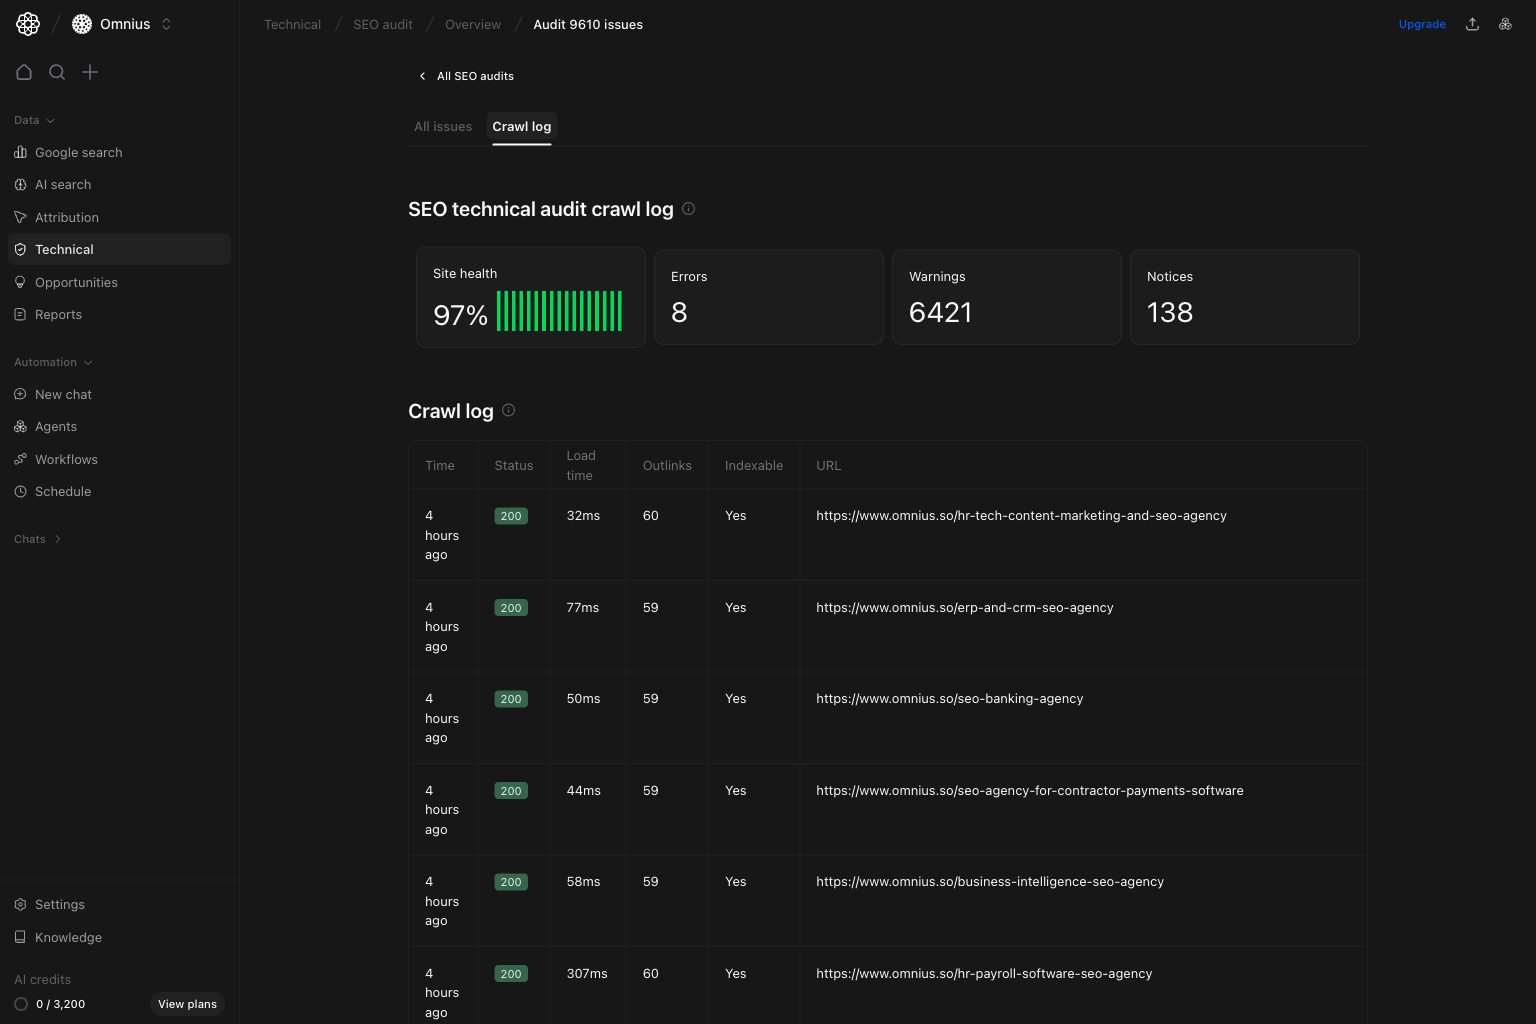
- Repeated HTTP errors, timeouts, or blocked responses.
- Failure clusters by folder/template.
- Crawl behavior changes after deployments.
- Issue counts changed sharply.
- Developers need URL-level crawl proof.
If the crawl log shows 403 responses
A403 means the website, firewall, or CDN blocked the crawler from reading the page. If the site uses Cloudflare or another bot protection tool, allow the Atomic AI site audit crawler by user agent:
robots.txt, sitemap files, and all public pages included in the audit.
After updating the firewall or bot rules, run the audit again and check the crawl log for successful 2xx or expected redirect responses.
Issue detail: affected URLs view
After selecting an issue class, use issue detail to assign exact fixes.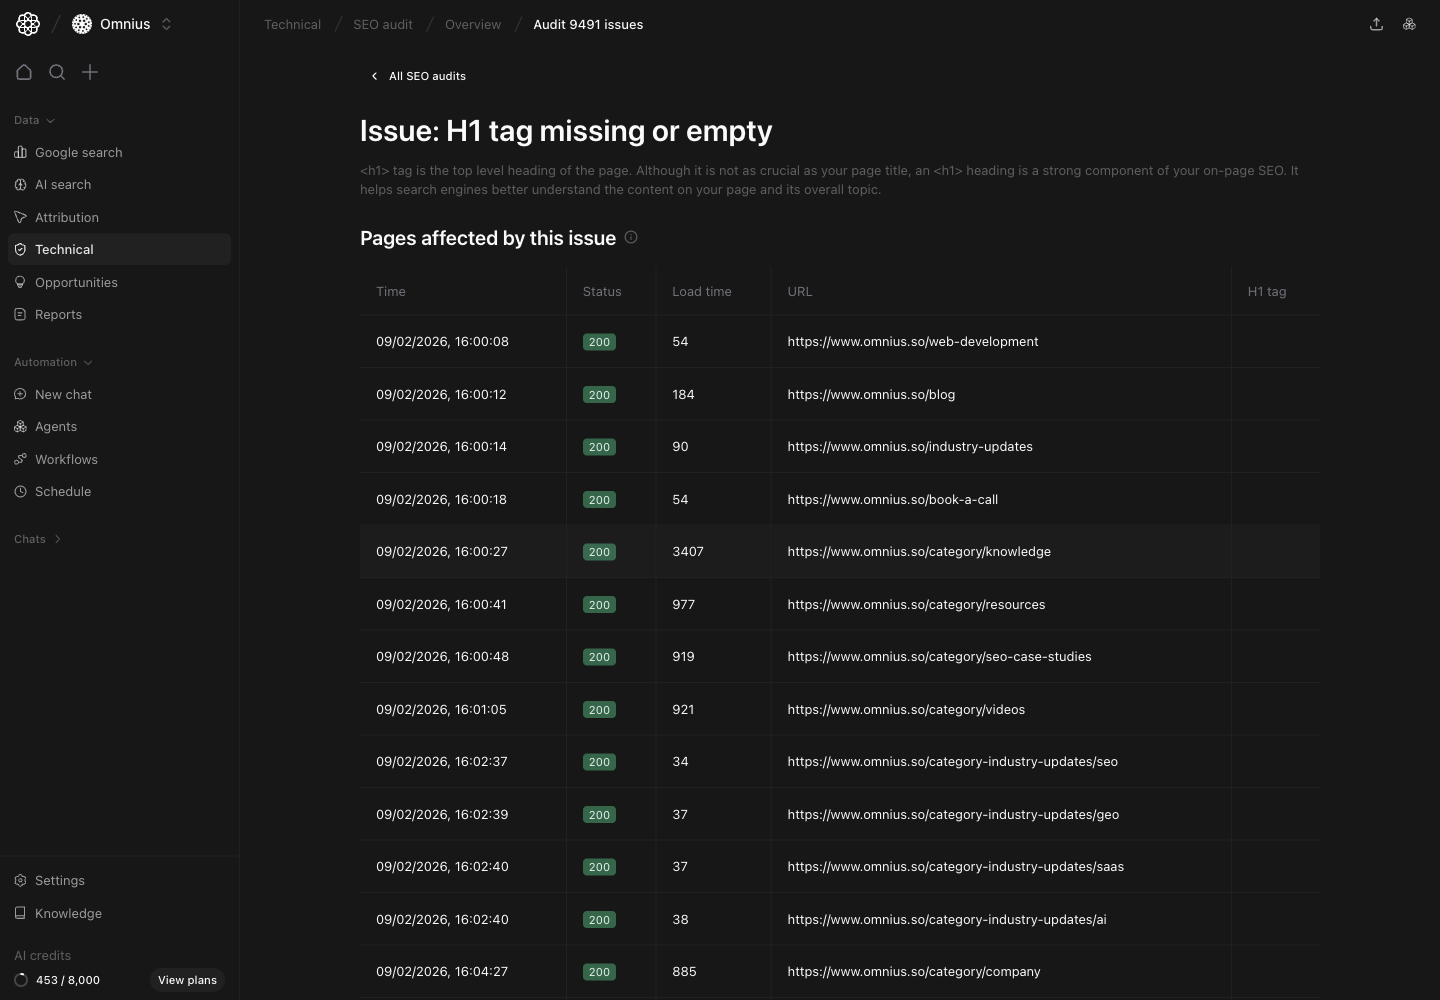
- Group URLs by template/folder.
- Prioritize commercial and high-visibility pages.
- Assign owner and deadline per URL group.
- Validate fixes in the next audit run.
- Many URLs in one path usually means a shared template defect.
- Mixed status behavior can indicate rendering/routing inconsistency.
Quick weekly checklist
- Check summary cards for direction change.
- Open latest run and triage top issue groups.
- Use crawl log to confirm root cause.
- Move to issue-detail URL lists and assign work.
- Validate reduction in the next completed run.
What to fix first
Team routine
- Weekly: run full triage from summary to issue-detail assignments.
- Bi-weekly: verify fix closure and rerun checks.
- Monthly: report resolved issue classes and repeated root causes.
Keep in mind
- One clean run does not prove long-term stability.
- Crawl-size shifts can change totals without real quality movement.
- Never mark fixes complete before the next successful audit confirmation.