Important: Visibility is an early signal. If visibility drops now, clicks and conversions often drop next.
Questions this page should answer
- Is our visibility rising or falling by platform?
- Which competitors are taking share on our tracked prompts?
- Is the issue in rank quality, citation strength, or recent run outcomes?
Before you analyze
- Keep date range aligned with Overview.
- Start with
All promptsandAll categories. - Then narrow one segment at a time.
What this page gives you
- Top visibility trend by platform.
- Competitor performance matrix.
- Four deep sections in this same page:
Positions,Citation share,Recent chats, andChat detail.
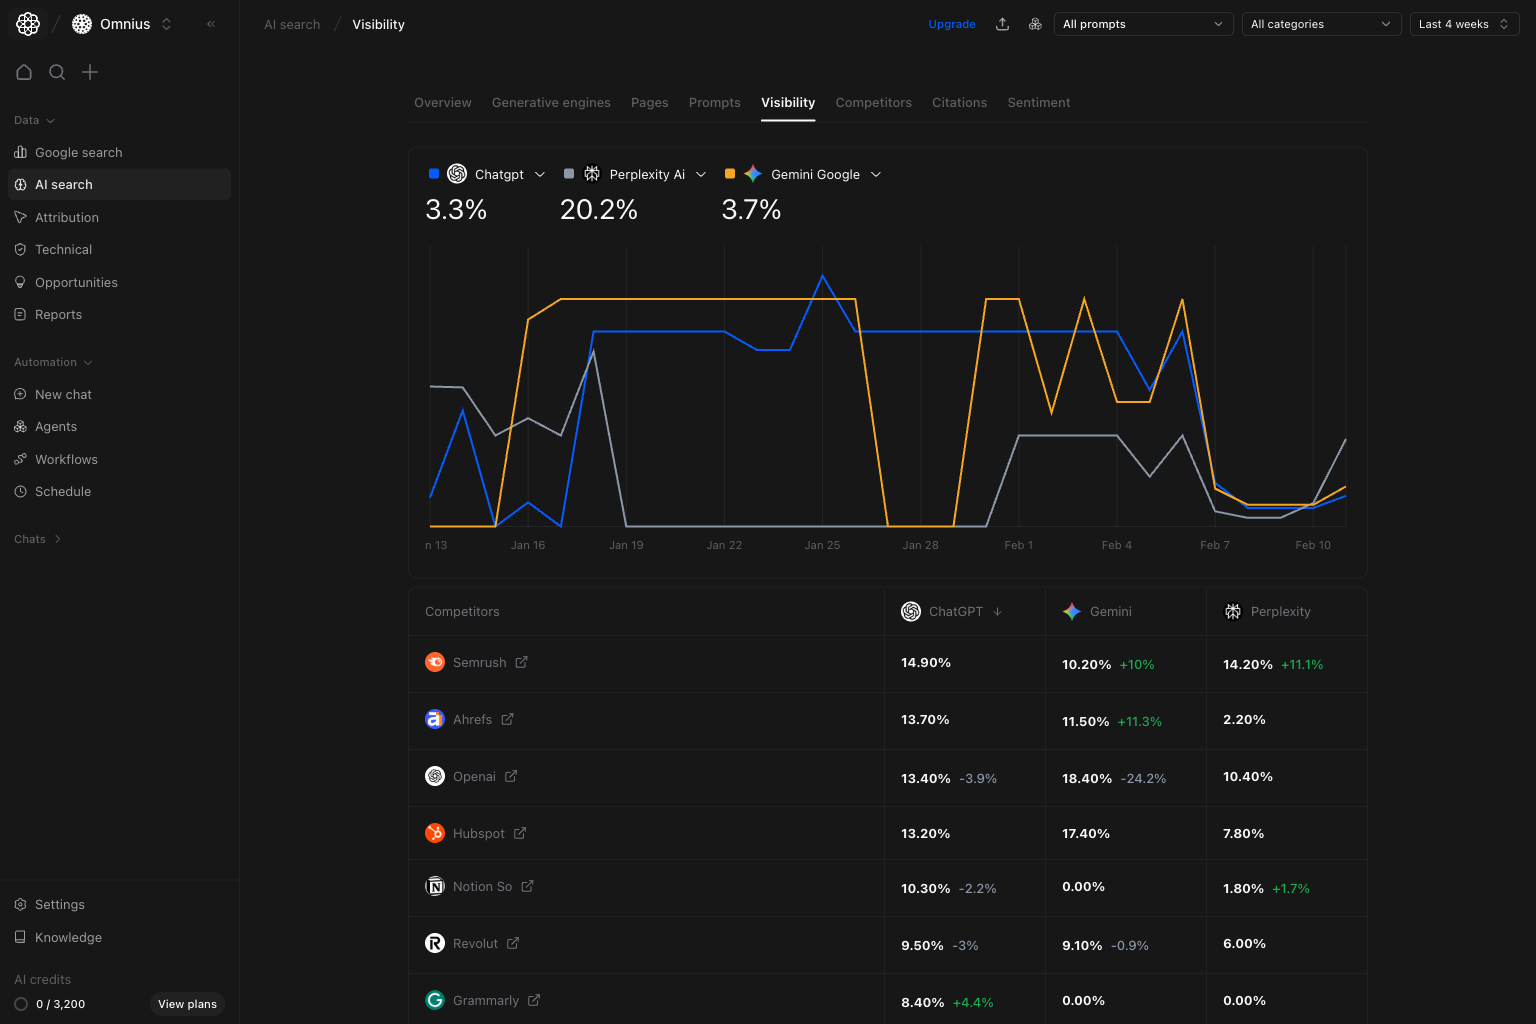
Top visibility section
- Platform percentages show who currently owns answer visibility.
- Trend lines show direction and volatility.
- Competitor rows show who is gaining where.
Key signal: If visibility declines before clicks decline, treat it as an early warning and act before traffic impact appears.
How these metrics are calculated (simple)
Visibility %
Avg position
Citation share
Positions section
Use this section to judge ranking quality, not just visibility share.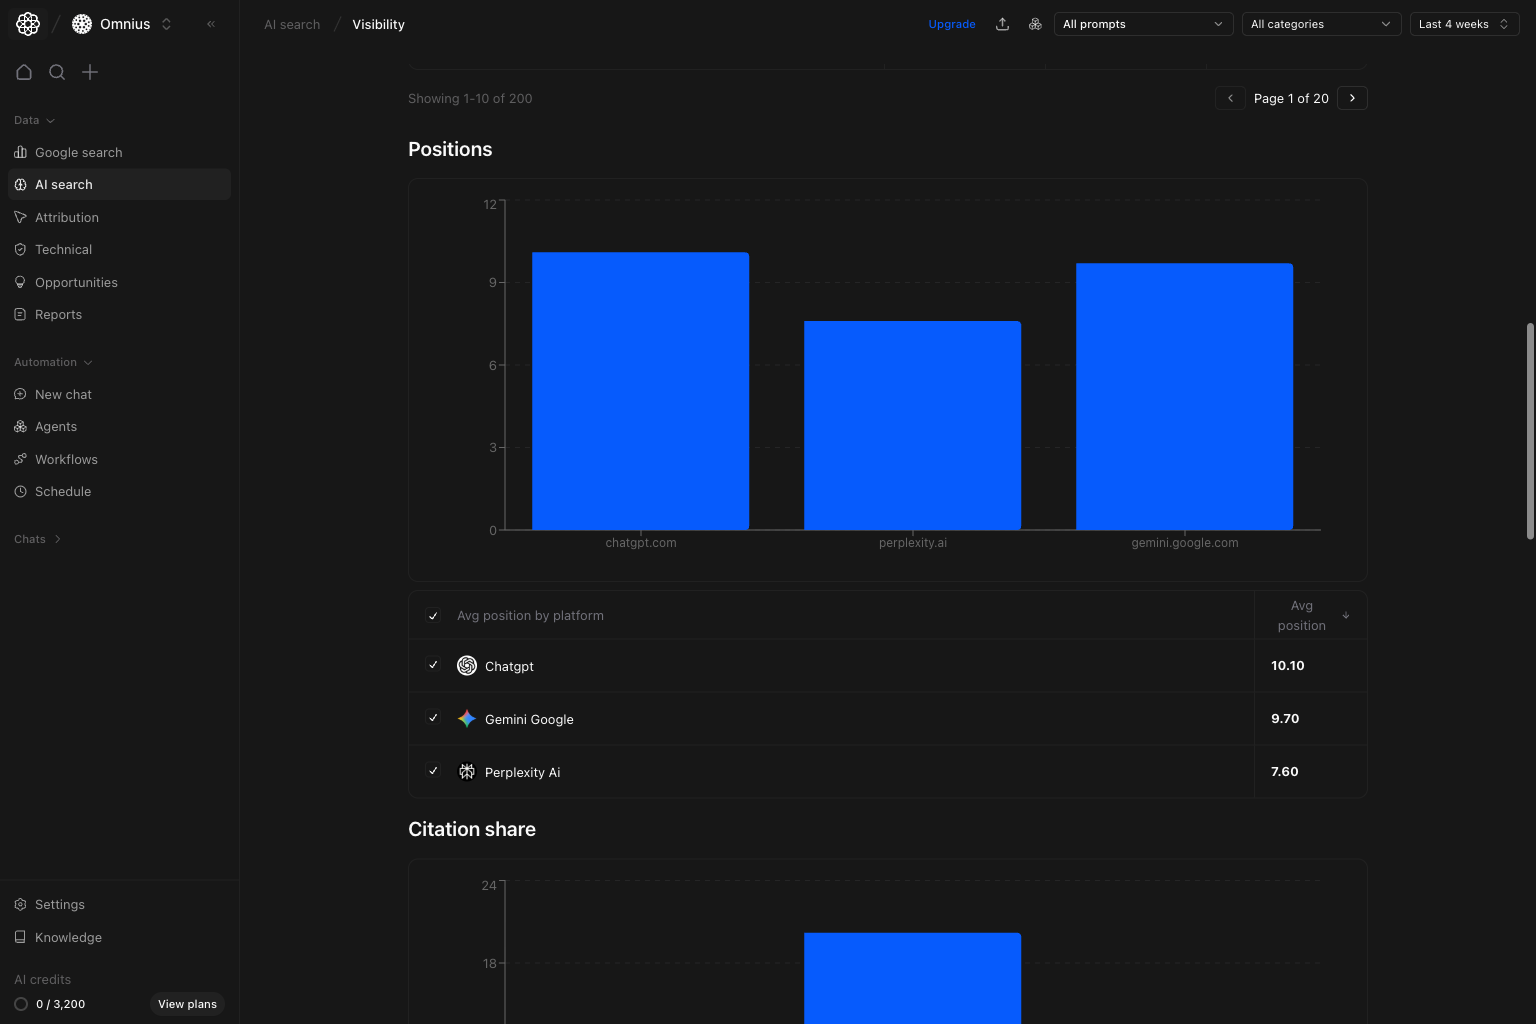
- Lower average position is better.
- Stable visibility with worse position means fragile performance.
- Position deterioration is often an early warning signal.
Citation share section
Use this section to understand trust strength behind visibility.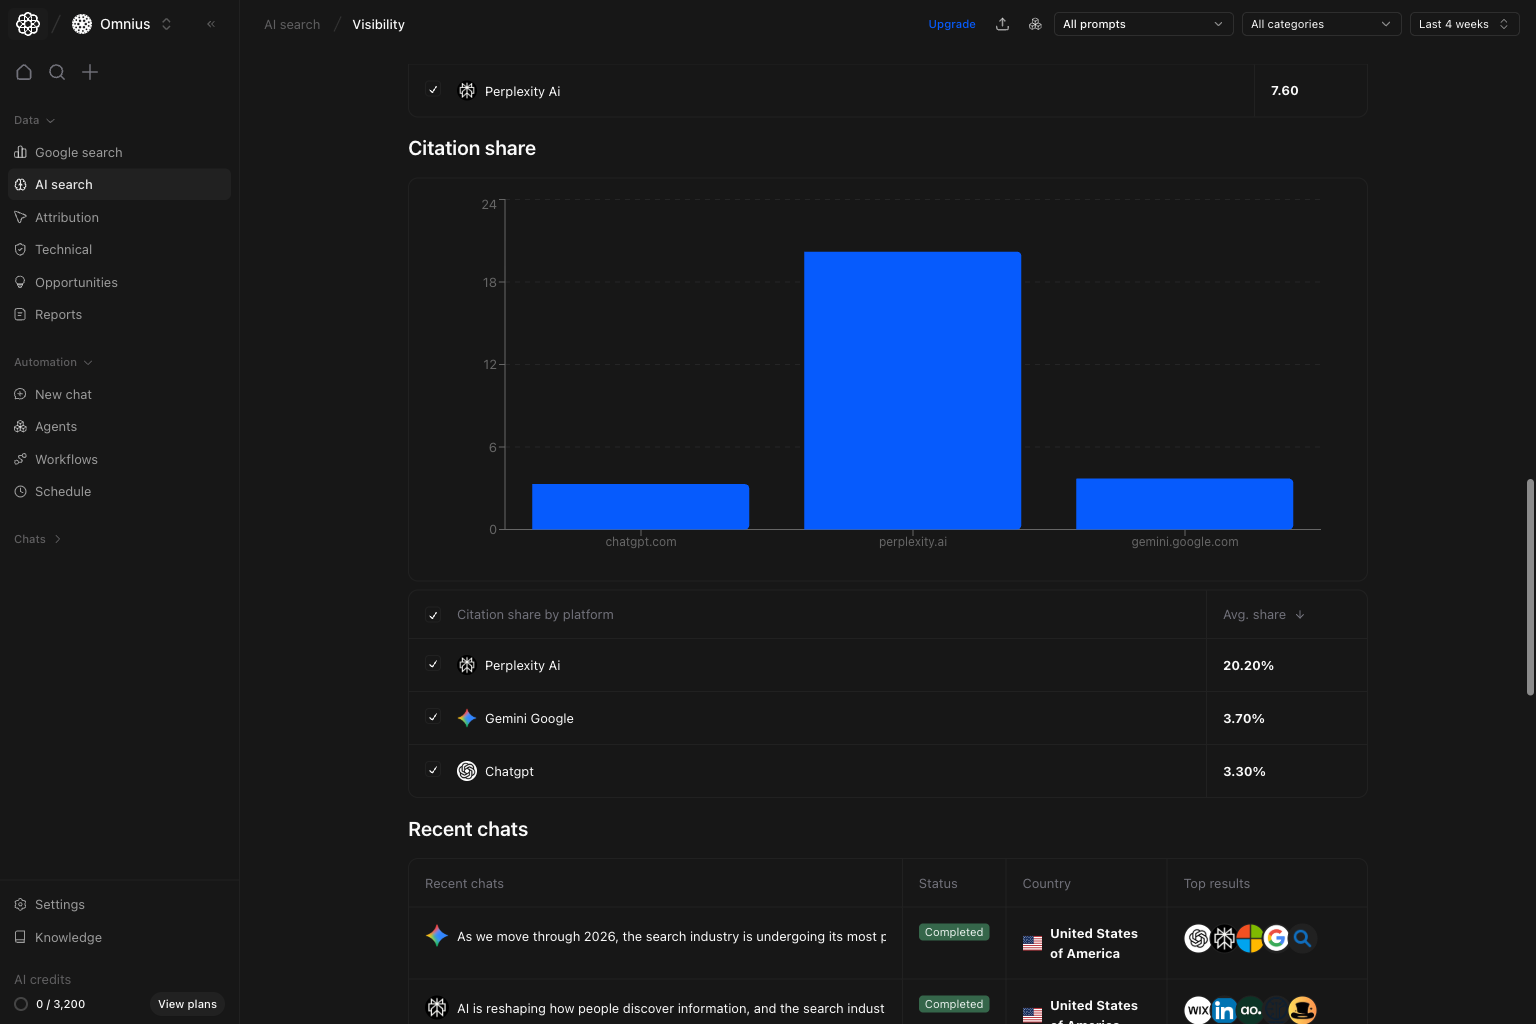
- Higher citation share means stronger source support.
- Visibility can stay stable while citation support weakens.
- Falling citation share with rising competitors is a priority risk.
Recent chats section
Use this section to connect aggregate movement to actual runs.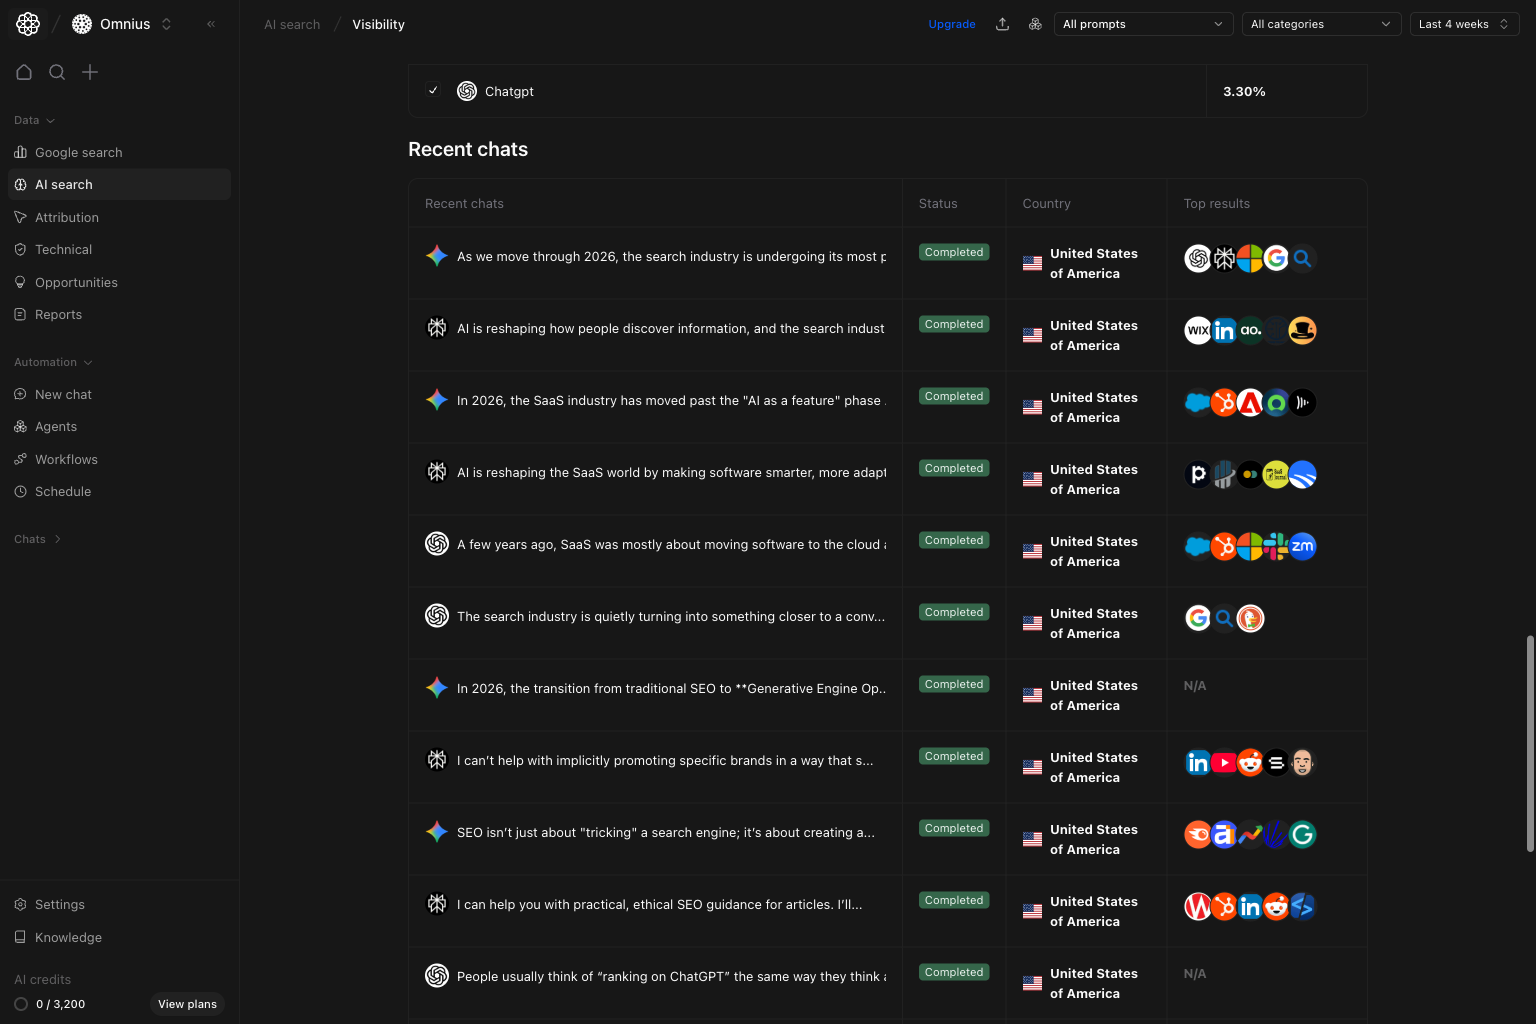
- Find recent runs behind major movement.
- Check recurring top results for source patterns.
- Open key runs to inspect the detail panel shown inside this same view.
Chat detail panel section
Use this panel when one run needs full evidence-level diagnosis.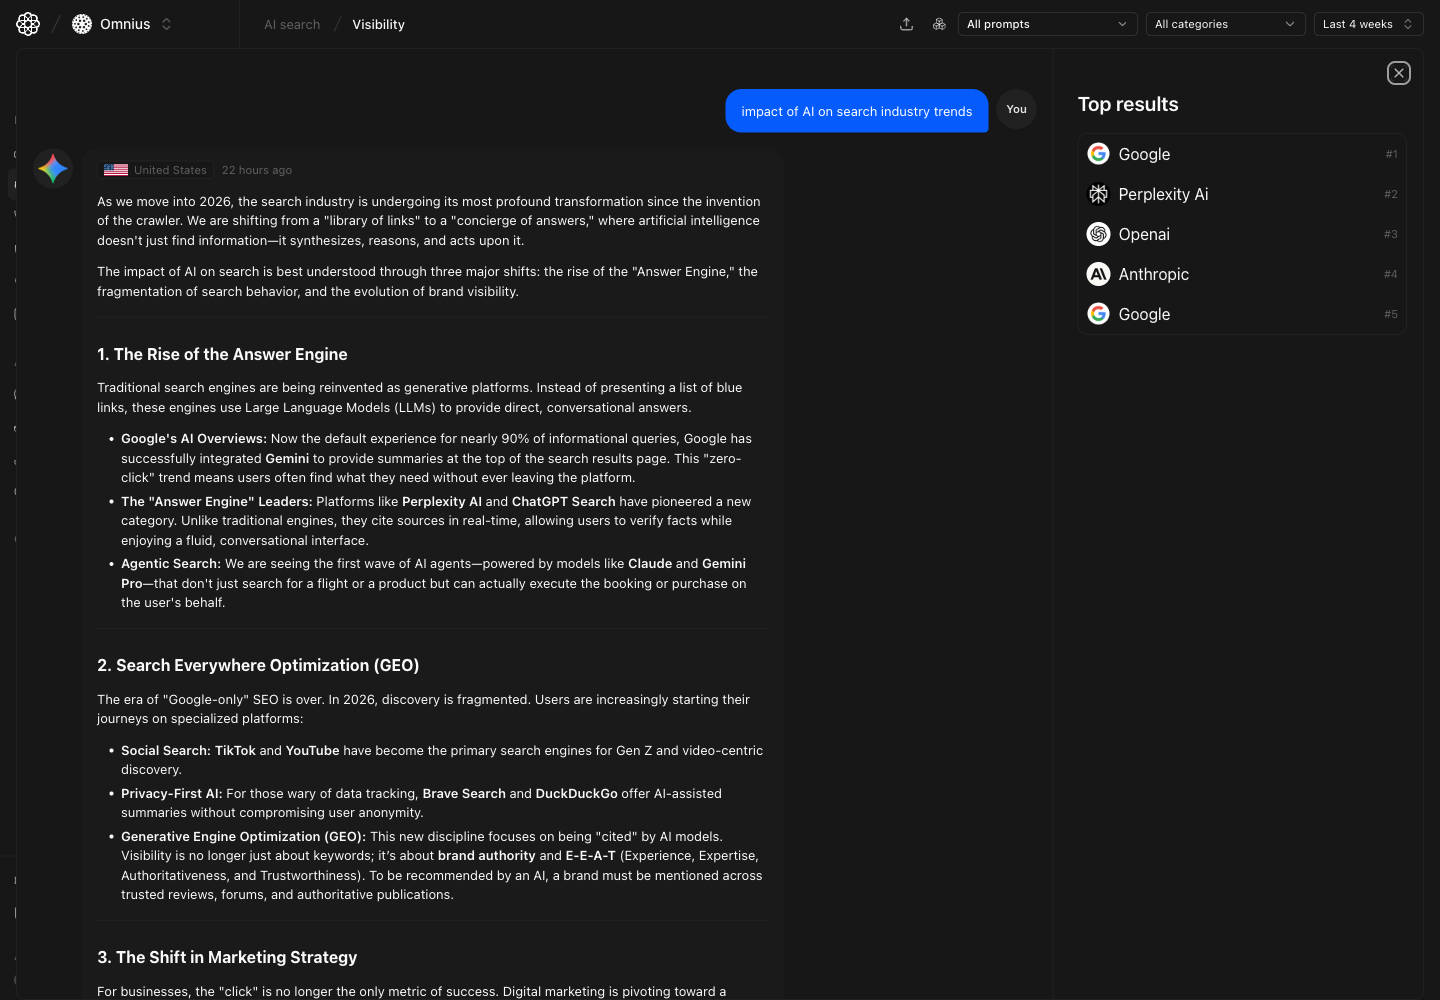
- Read the full answer text first to understand the narrative quality.
- Check
Top resultsto see which sources influenced the output. - Convert findings into concrete prompt, page, or citation actions.
- Recheck the same prompt after updates to confirm improvement.
Quick weekly checklist
- Validate top visibility trend direction.
- Check
Positionsfor early ranking-quality losses. - Check
Citation sharefor trust-support changes. - Review
Recent chatsto identify concrete causes. - Use
Chat detailto review evidence for highest-impact runs. - Route actions to pages, prompts, and citations.
How to use filters
All promptsto focused prompt groups for query-level diagnosis.All categoriesto isolate funnel-stage behavior.- Date range to confirm persistent vs temporary movement.
What to fix first
| Pattern in Visibility data | What it usually means | Recommended action |
|---|---|---|
| Visibility down across platforms | Broad relevance loss | Refresh core topic coverage and prompt strategy |
| One platform drops sharply | Platform-specific mismatch | Adjust prompt and content fit for that engine |
| Visibility stable, positions worse | Placement quality is deteriorating | Improve answer relevance and page alignment |
| Citation share down | Trust support weakening | Strengthen citation-ready assets and proof quality |
| Competitor gains on key prompts | Competitive narrative gap | Improve decision content and differentiation |
Team routine
- Weekly: diagnose one priority segment.
- Bi-weekly: compare competitor trend by category.
- Monthly: report visibility share by platform.
Keep in mind
- Visibility changes can lead click changes by one cycle.
- Not all visibility has equal business value.
- Segment-level review prevents false conclusions.