- Is organic visibility moving in the right direction?
- What is driving the change: demand, rankings, or click-through rate?
- What should we do next this week?
Before you analyze
- Make sure Google Search Console is connected to the project.
- Pick a date range that matches your reporting schedule.
- Compare equivalent periods before concluding performance changed structurally.
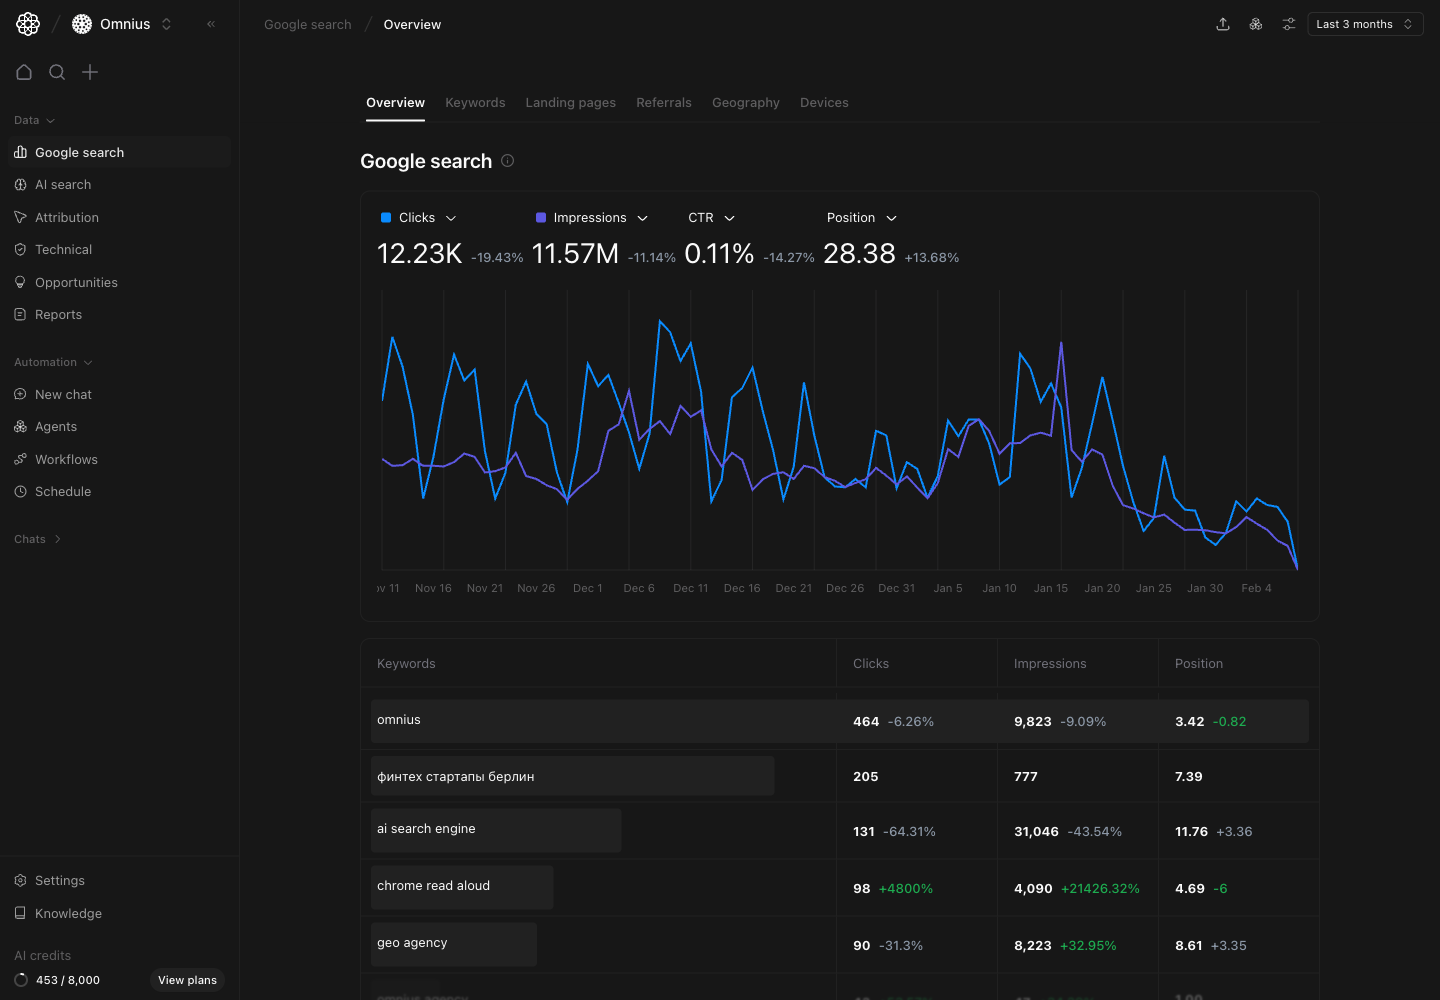
What this page gives you
The overview combines:- A top-level trend chart for key organic metrics.
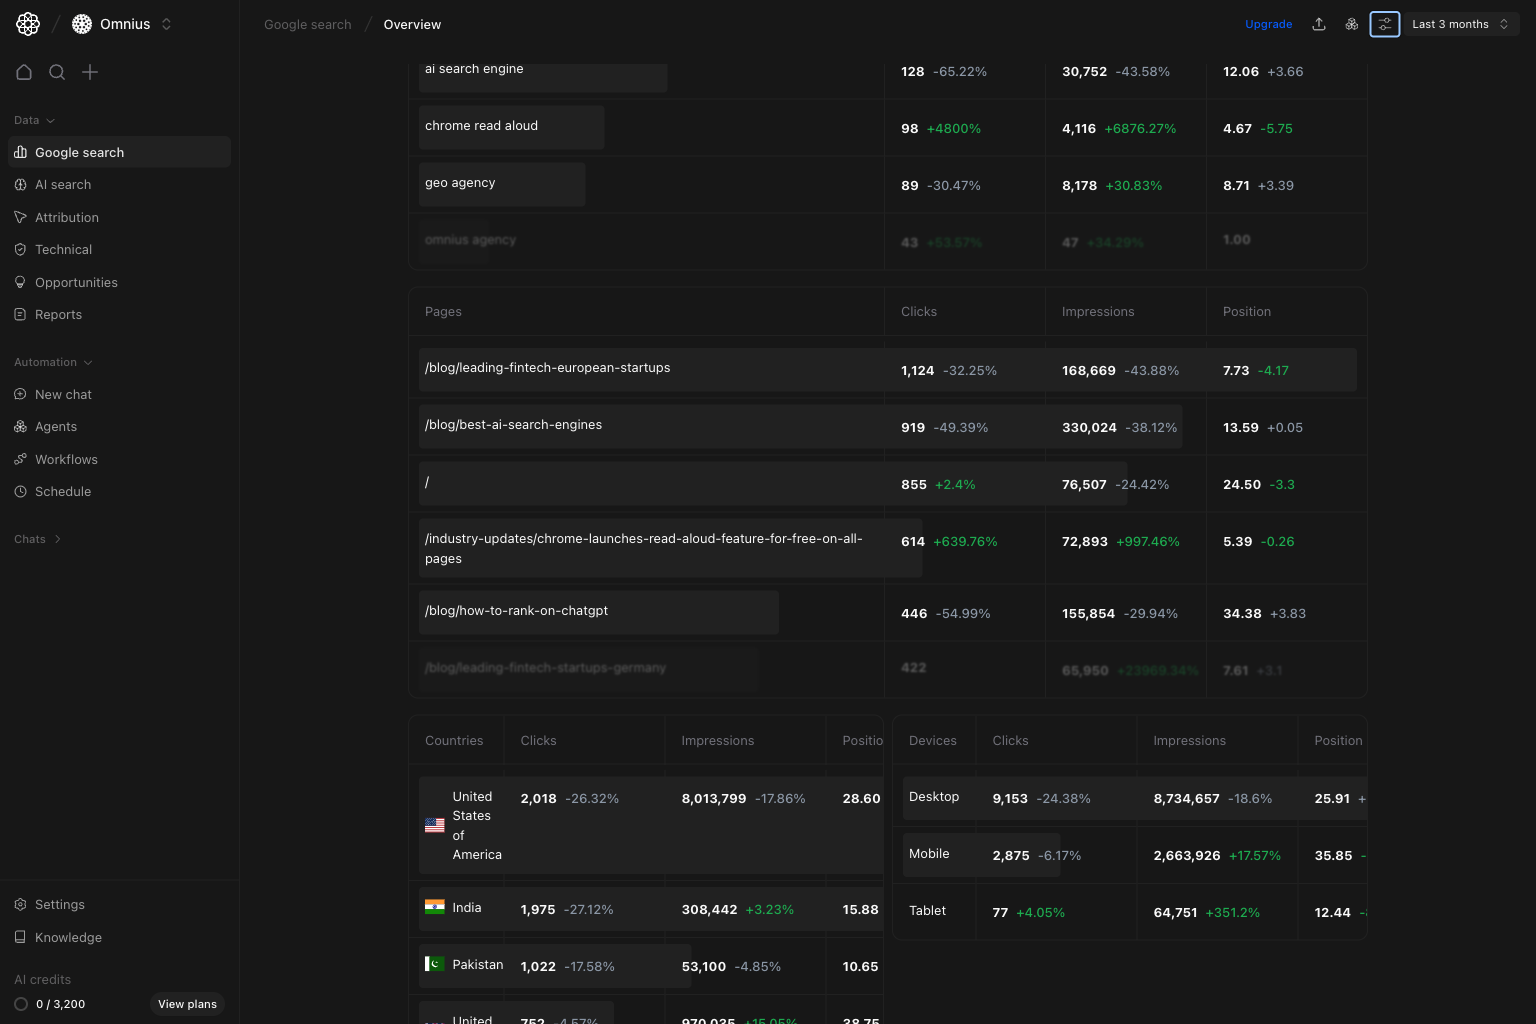
- Fast previews of the most important breakdown tables.
- Shared filters (
Keyword,Page,Device,Country) so you can narrow the data before drilling down.
How to read each metric correctly
| Metric | What it tells you | Common misread |
|---|---|---|
| Clicks | Organic visits from Google Search | Treating short-term swings as permanent change without checking other metrics first |
| Impressions | How often your pages were shown in Google results | Assuming impressions always mean qualified traffic |
| CTR | How often people click after seeing your result | Reading CTR without checking position and query mix |
| Position | Average ranking across included queries and pages (lower is better) | Treating average position as a single keyword rank |
Quick weekly checklist
- Start with trend direction. Confirm whether clicks and impressions are moving up, flat, or down.
- Check CTR and position movement.
Separate ranking issues (
Position) from snippet/intent issues (CTR). - Scan preview tables. Look for concentration risk: a small set of pages, countries, or devices driving most movement.
- Segment with filters. Narrow to one country or device when movement is not uniform.
- Assign next actions. Route issues to content, technical SEO, internal linking, or market-specific teams.
How to use filters
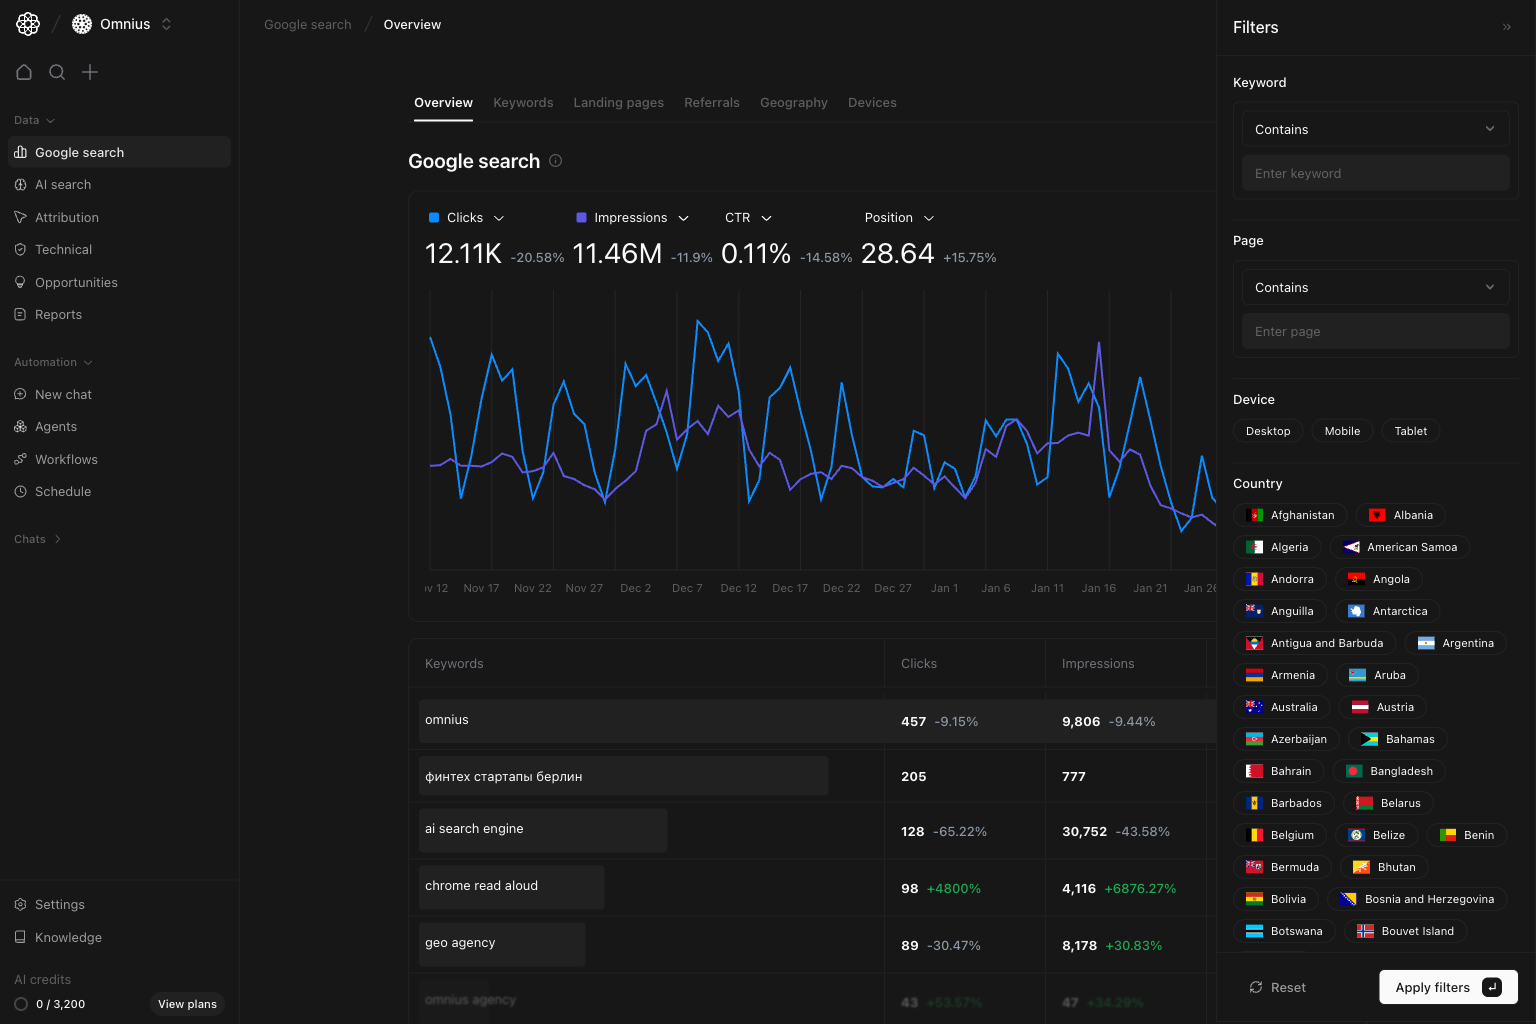
Keyword contains [topic cluster]Check if a topic initiative is improving visibility.Page contains [/blog/ or /product/]Compare template performance and find weak URL groups.Device = MobileCheck for mobile-specific issues before prioritizing fixes.Country = [target market]Use this for international analysis and market-specific planning.
What to fix first
| Signal in overview | What it usually means | Go next |
|---|---|---|
| Impressions up, CTR down | Pages are shown more, but snippets are not getting clicks | Keywords, then Landing pages |
| Impressions down, position down | Ranking loss, technical issues, or content getting stale | Landing pages, then Technical overview |
| Clicks down, impressions flat | Click-through rate dropped on important queries | Keywords |
| Mobile down, desktop stable | Likely mobile UX or template issue | Devices, then Landing pages |
| One country drops while others are stable | Regional competition or localization gap | Geography |
Team routine
Use this structure in weekly client updates:Performance summary: “Organic clicks are [up/down] by X% for [period].”Driver summary: “Main change comes from [queries/pages/country/device].”Action plan: “This week we will [titles/meta refresh, content update, internal links, technical fix].”Impact window: “We expect movement in [2-6] weeks depending on crawl speed and index updates.”
Keep in mind
- Google Search Console data is delayed by 1-3 days.
- Position is an average across many queries and URLs.
- Seasonality and campaign timing can change demand; validate against comparable periods.
Where to go next
- Keywords: query-level opportunities and losses
- Landing pages: URL-level winners and declines
- Geography: country-level performance shifts
- Devices: device split and mobile/desktop issues
- Referrals: source-level context beyond rankings