Important: Review this page first, then drill down. It prevents teams from optimizing the wrong source or page.
Questions this page should answer
- Are AI clicks and conversions moving in the same direction?
- Which AI sources are helping most, and which are weakening?
- Which pages should we prioritize first this sprint?
Before you analyze
- Set the same date range you will use on the other AI Search pages.
- Compare against an equivalent prior period.
- Start unfiltered so you see the global pattern first.
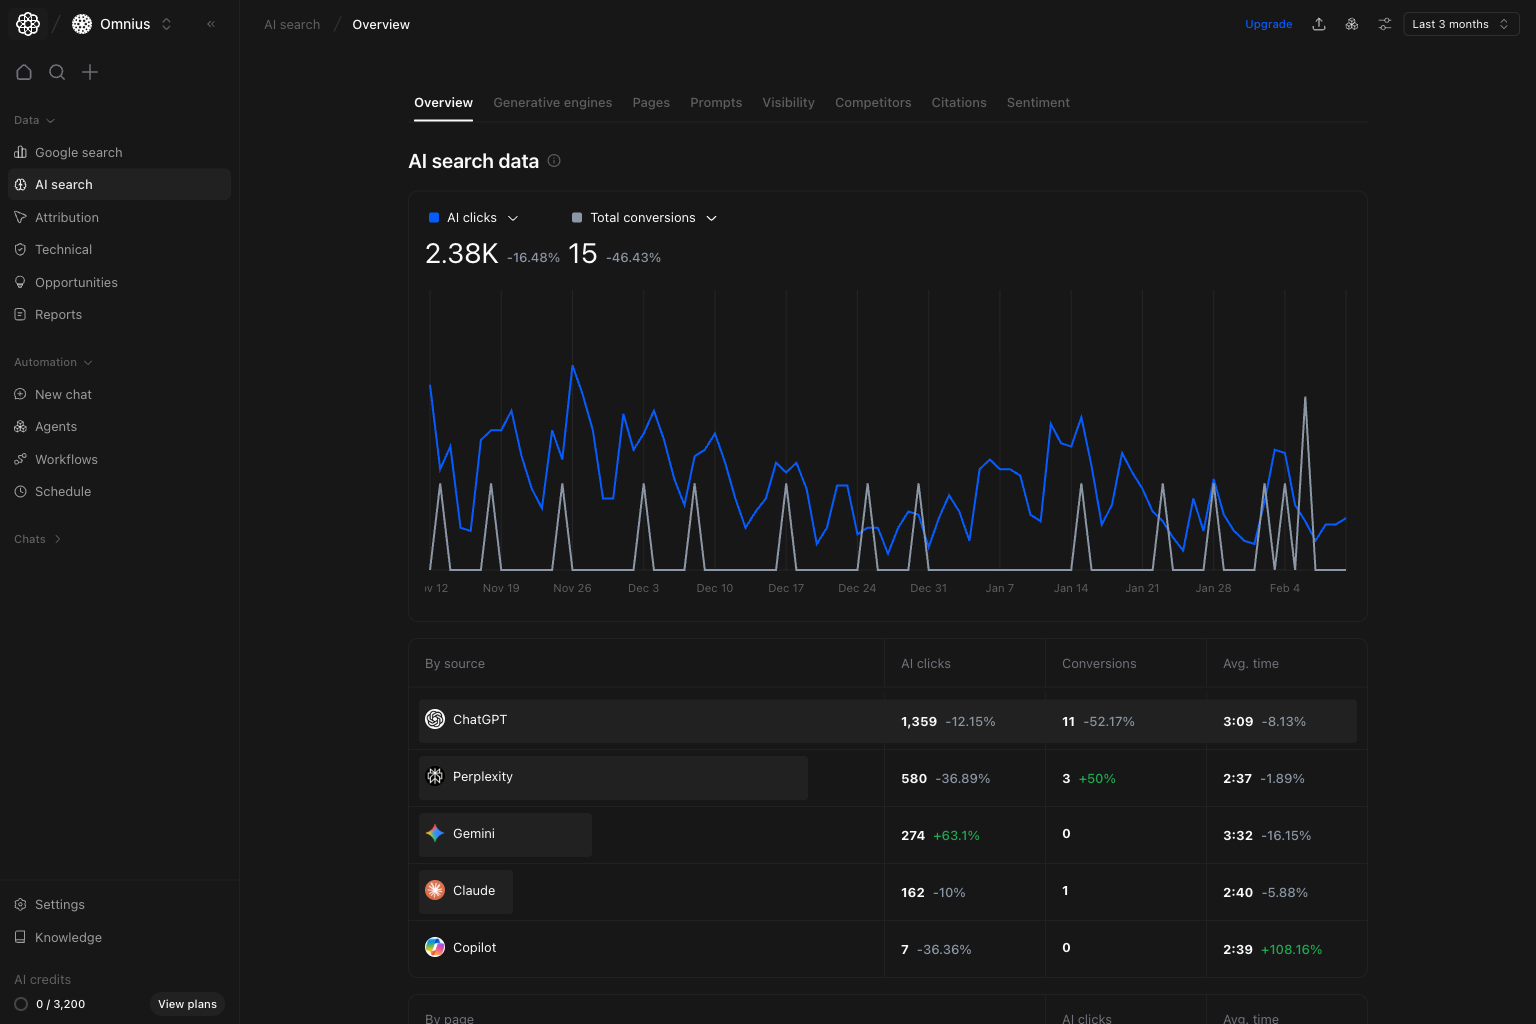
What this page gives you
- A top trend for
AI clicksandTotal conversions. - A
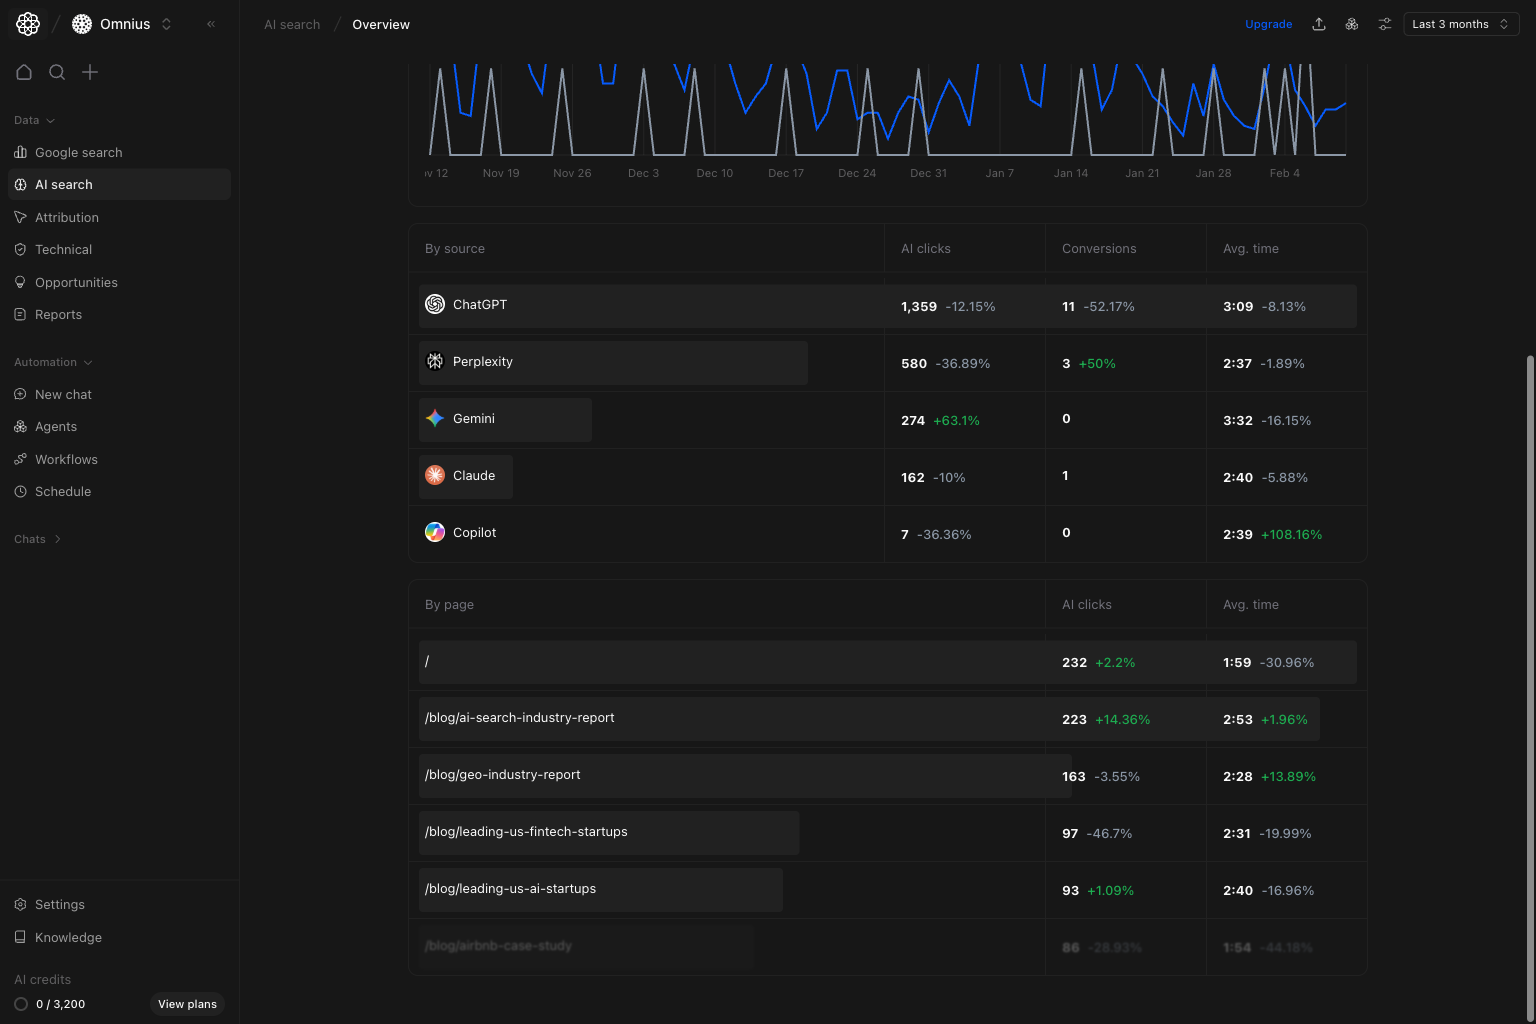
By sourcetable to compare AI engines. - A
By pagetable to see which URLs drive AI traffic quality.
How to read the top trend correctly
AI clicks: sessions coming from AI platforms.Total conversions: tracked outcomes after those visits.
- Clicks up, conversions down: traffic quality or intent fit is weak.
- Clicks flat, conversions up: landing page quality likely improved.
- Clicks down, conversions down: visibility or prompt coverage problem is likely.
Key signal: If clicks and conversions both decline, start with visibility and prompt coverage checks before page-level edits.
Example: If ChatGPT clicks drop 22% and conversions drop 18% in the same week, first review Visibility and Prompts for that source before changing landing pages.
How these metrics are calculated (simple)
AI clicks
AI clicks are the total sessions attributed to supported AI referrers in the selected date range.Total conversions
Total conversions are the selected GA4 conversion events generated by those AI-attributed sessions.By source section
By source to decide engine focus for the week:
- Prioritize sources with strong conversion efficiency.
- Flag sources with sharp drop in clicks and conversions.
- Avoid over-investing in sources that drive volume but no business impact.
By page section
In the same table view, useBy page to choose URL-level actions:
- Pages with high AI clicks and weak avg. time need better on-page clarity.
- Pages with stable traffic but falling outcomes need message refinement.
- Pages with improving outcomes are templates for replication.
Quick weekly checklist
- Confirm top-line direction from clicks and conversions.
- Pick one growth source and one declining source.
- Pick three URLs for immediate improvement.
- Route deeper analysis to the right page: Visibility, Prompts, Pages, or Citations.
How to use filters
- Use date range first to keep reporting consistent.
- Narrow by one segment at a time when validating a hypothesis.
- Do not compare mixed filter sets in the same decision.
What to fix first
| Pattern in Overview data | What it usually means | Recommended action |
|---|---|---|
| Clicks down and conversions down | Visibility or prompt relevance loss | Check Visibility and Prompts first |
| Clicks up, conversions flat | Traffic quality mismatch | Improve destination pages and intent alignment |
| One source drops sharply | Platform-specific issue | Investigate Generative engines and competitors |
| Stable traffic, weaker avg. time | Content experience mismatch after the click | Improve page structure and value clarity |
Team routine
- Weekly: run Overview first before any deep dive.
- Bi-weekly: compare source efficiency changes.
- Monthly: report AI Search contribution to business outcomes.
Keep in mind
- AI traffic can be volatile in short windows.
- Conversion lag can hide recent improvements.
- Top-line trend is useful only when paired with source and page context.